Category: Dissertation

And it’s over…

I ran out of time (again). There were too many changes needed in the dissertation in order to make it acceptable for my committee, and not enough time to complete them.

I am taking some time off from this research, but will be back next year. I would like to turn the research into a book of some sort.

Thanks to all who commented and supported this research.

A new argument, a new focus, a new chapter.

It’s kind of late in the game, but at least I’m here.

I’ll skip all the dramatic events from the past few months, and just say, I have two more months to finish edits to this dissertation.

I was forced to realize that my previous itteration of the dissertation did not have a clear historical argument (ie, it did not argue for or against anything that other historians wrote about).

Without going into detail, there is a new Chapter One. Basically completely rewritten. Here: http://nazitunnels.org/dissertation/chapter1/

A week in the life of writing a dissertation

I recently had a whole week to work on my dissertation. Each day I wrote my
thoughts at the beginning of the day and a short To Do list. I thought I would
share as it is a small glimpse into the process of writing a large scholarly
work.

Monday, July 11, 2016

Today I worked on
– flow and structure of Chapter 1, part 2.
– take out all of the passive voice in chapter 1, part 2, and parts of the
Introduction.
– Export parts of the Intro and Chapter 1 to Word document to send to
committee.

Didn’t finish going through:
– flow and narrative of Research Question and Argument sections of the
Introduction.
– flow and argument of Chapter 1, part 2, to see if it fits section
conclusion.

Tuesday, July 12, 2016

I should read through the chapters about the prisoners to see if they actually
uphold my new argument…

To do today:
– Read Introduction for flow and narrative. Check for grammar, argument, etc.
– Read Chapter 1, part 2 for flow, narrative, grammar, and to see if it fits
the conclusion of that section.
– Format and send it to committee.

Need to research:
– which historians argue that “Vernichtung durch Arbeit” was selectively
applied, and which do not.

Wednesday, July 13, 2016

Maybe I should just roll Chapter 1, part 1 into part 2 and not have parts.

To do today:
– Read through Koel book on history of the SS.
– Start reading Langerich’s biography of Himmler (decided to get the English
version for the sake of time).
– Read through Chapter 3 to see if my new argument is supported
– Notes while reading:
– Clarrify argument for the chapter and rewrite the chapter introduction.
– Use available works about the Neuengamme KL when discussing the
Neuengamme KL
– Address the vast literature about the Holocaust and KL research. Put
the most important in a big footnote.
– Passive voice should be removed!
– Prison Infirmary section: Add wordage that talks about how the SS did
not care for the inmates and wanted them to die.
– Technical writing point: Add @ to the end of the Zotero source when
citing multiple sources. Then in Word, search for '.@' and replace with
','.

Thursday, July 14, 2016

Really frustrated and depressed about the dissertation today. I don’t think I’ll
get it finished, and I don’t care to work on it anymore. I don’t think I’ll get
the argument right. I probably can’t justify/support the argument based on the
research I have already done, and I can’t handle any more research at the
moment. It’s never enough! (This song comes to mind: https://youtu.be/37tzsSP-Dc0)

Well, suck it up, quit whining (elitist, 1st world problems) and get back to
reading through Chapter 3.

Notes while reading:
– At beginning of Prisoner Hierarchy section, discuss why important and what
it shows about SS ideology vs. economic drive.
– Do this for each section.
– Prisoner Hierarchy section:
– Make note that this camp used similar hierarchy as other camps. Self
regulating inmates.
– Section on hair: provide more analysis. What did the different hair cuts
mean?
– Letters and packages section: Show that Danish were privileged because
they were the only ones allowed to send and receive letters and packages.

Friday, July 15, 2016

So, good news back from the committee which means I’m in good spirits again.
What I did was actually good and acceptable. So now, moving on. Some thoughts:
– Perhaps just merge part 1 and part 2 of chapter 1.
– Maybe leave Chapter 3 and 4 as is with a clarification or argument that the
survivor voices should stand on their own. Then a fifth chapter analyzing
them?

To do today:
– Read through Spoerer book, to say that I have and footnote it, shows basics
of SS history. Found really good article by Spoerer with discussion about
defining the terms forced laborer, foreign laborer, slave laborer, and
less-than-slave laborer. Use this in Chapter 1 instead of the confusing
paragraph I had before.
– Merge part 1 and 2 in Chapter 1. (not done yet)
– Write up this weeks notes as a blog post (done a few days later)
– Format Chapter 1 and update the dissertation website (not done yet).

Dissertation is live and on line

I am in the final stages of editing… hopefully. The plan is to finish this summer, defend in September, and graduate in December 2016.

Now that I have all of the chapters written, and they just need some work (apparently lots and lots of work), I have put the text and images online in their own website.

http://nazitunnels.org/dissertation

A write up of the technology and decissions made in the site will be forth coming.

All of the primary sources that I reference are also online and available. The process and decissions for creating this repository will be in a following blog post.

All of the incremental changes made to the “official” version of the dissertation can be seen in the GitHub repository for the dissertation text.

https://github.com/mossiso/dissertation-text/commits/master?page=1

There is still a lot to work on. Another 20 books of supporting material to read through and incorporate into the text.

Grammar and style to fix…

Overwhelming, but nearing the end.

The Writing Stack: Zotero -> Scrivener -> ODT -> Docx -> Markdown -> HTML

Scrivener to Markdown and HTML

How to write in Scrivener and display in HTML, Markdown, ODT, or Doc and keep the footnotes and images.

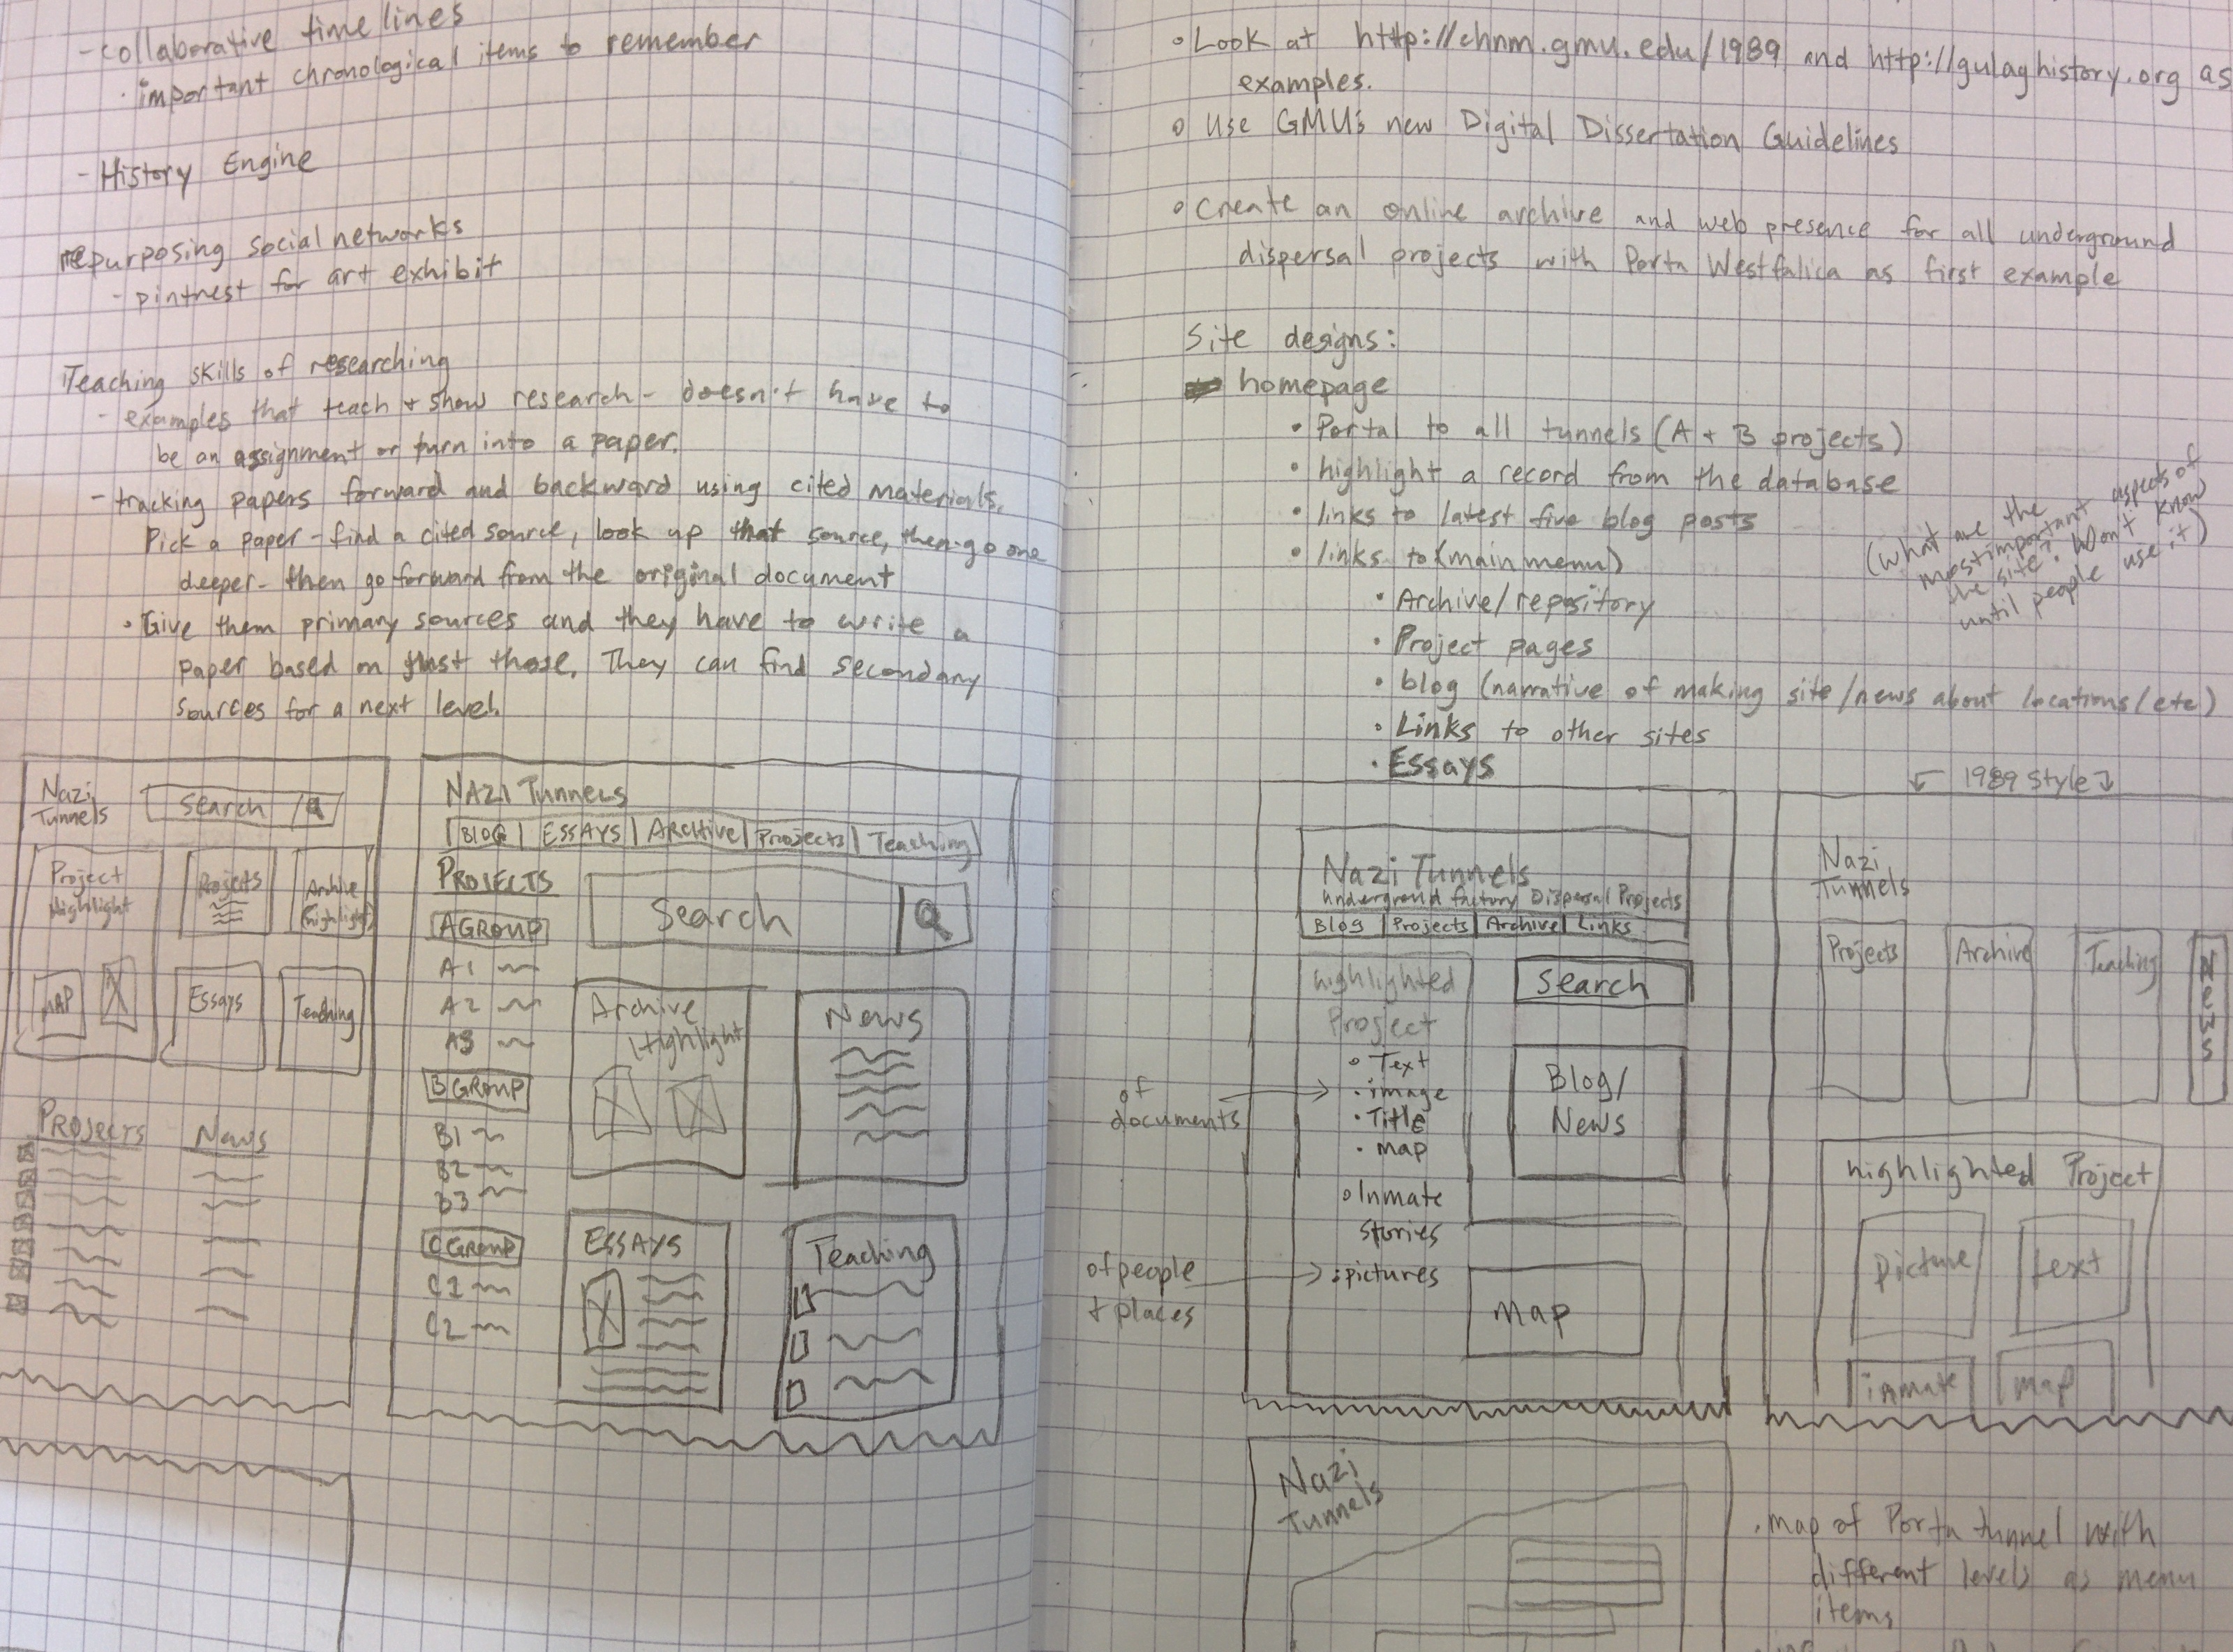
This is the process I use for getting my chapters out of Scrivener and formatted into Markdown and HTML for putting on the web. Markdown for Github, and HTML for a static website, and Doc for turning in to advisors and the Library.

Write it

Use Scrivener to bring all of the notes and sources together in one place.

Note it

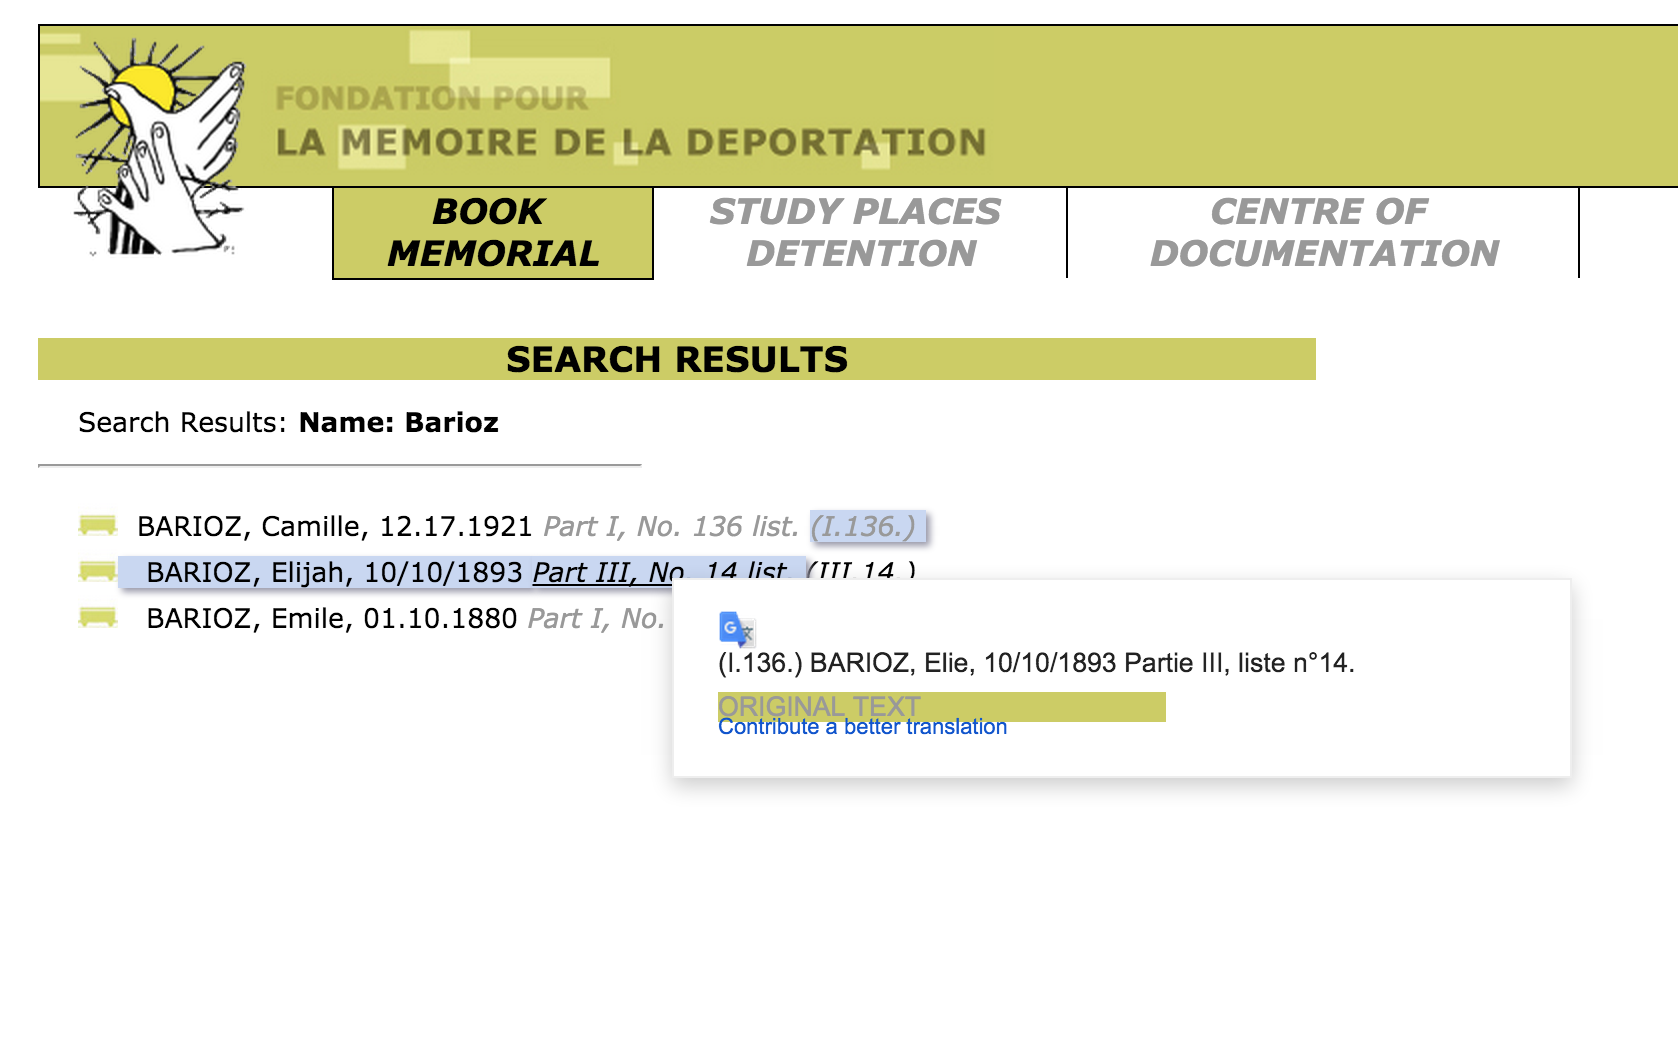
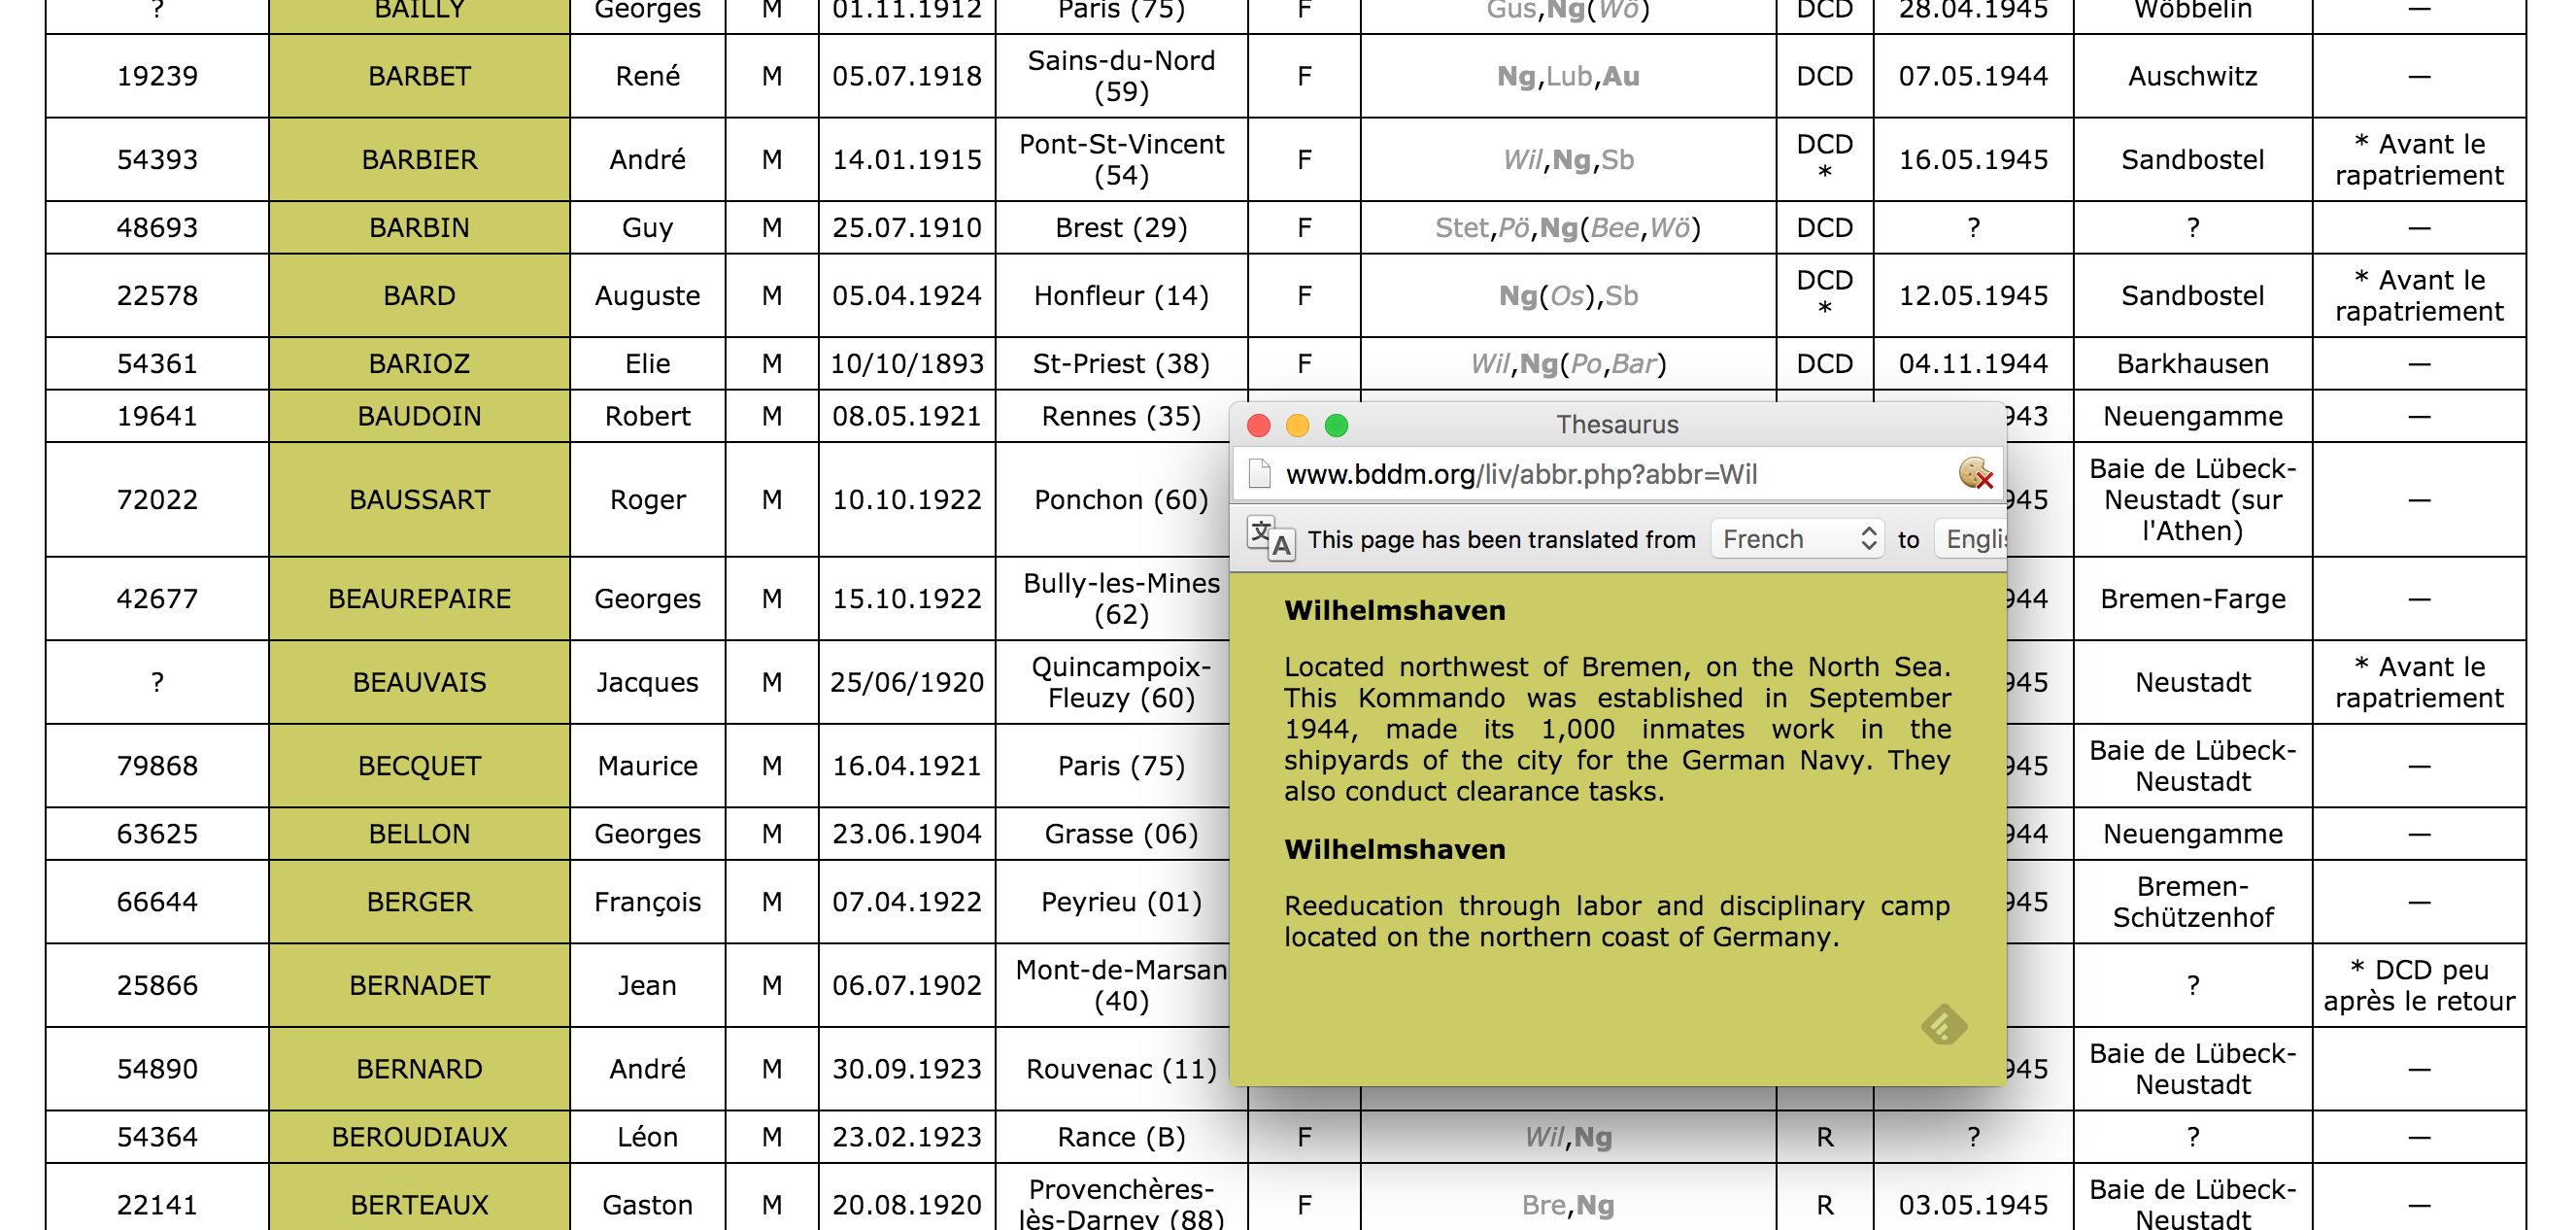
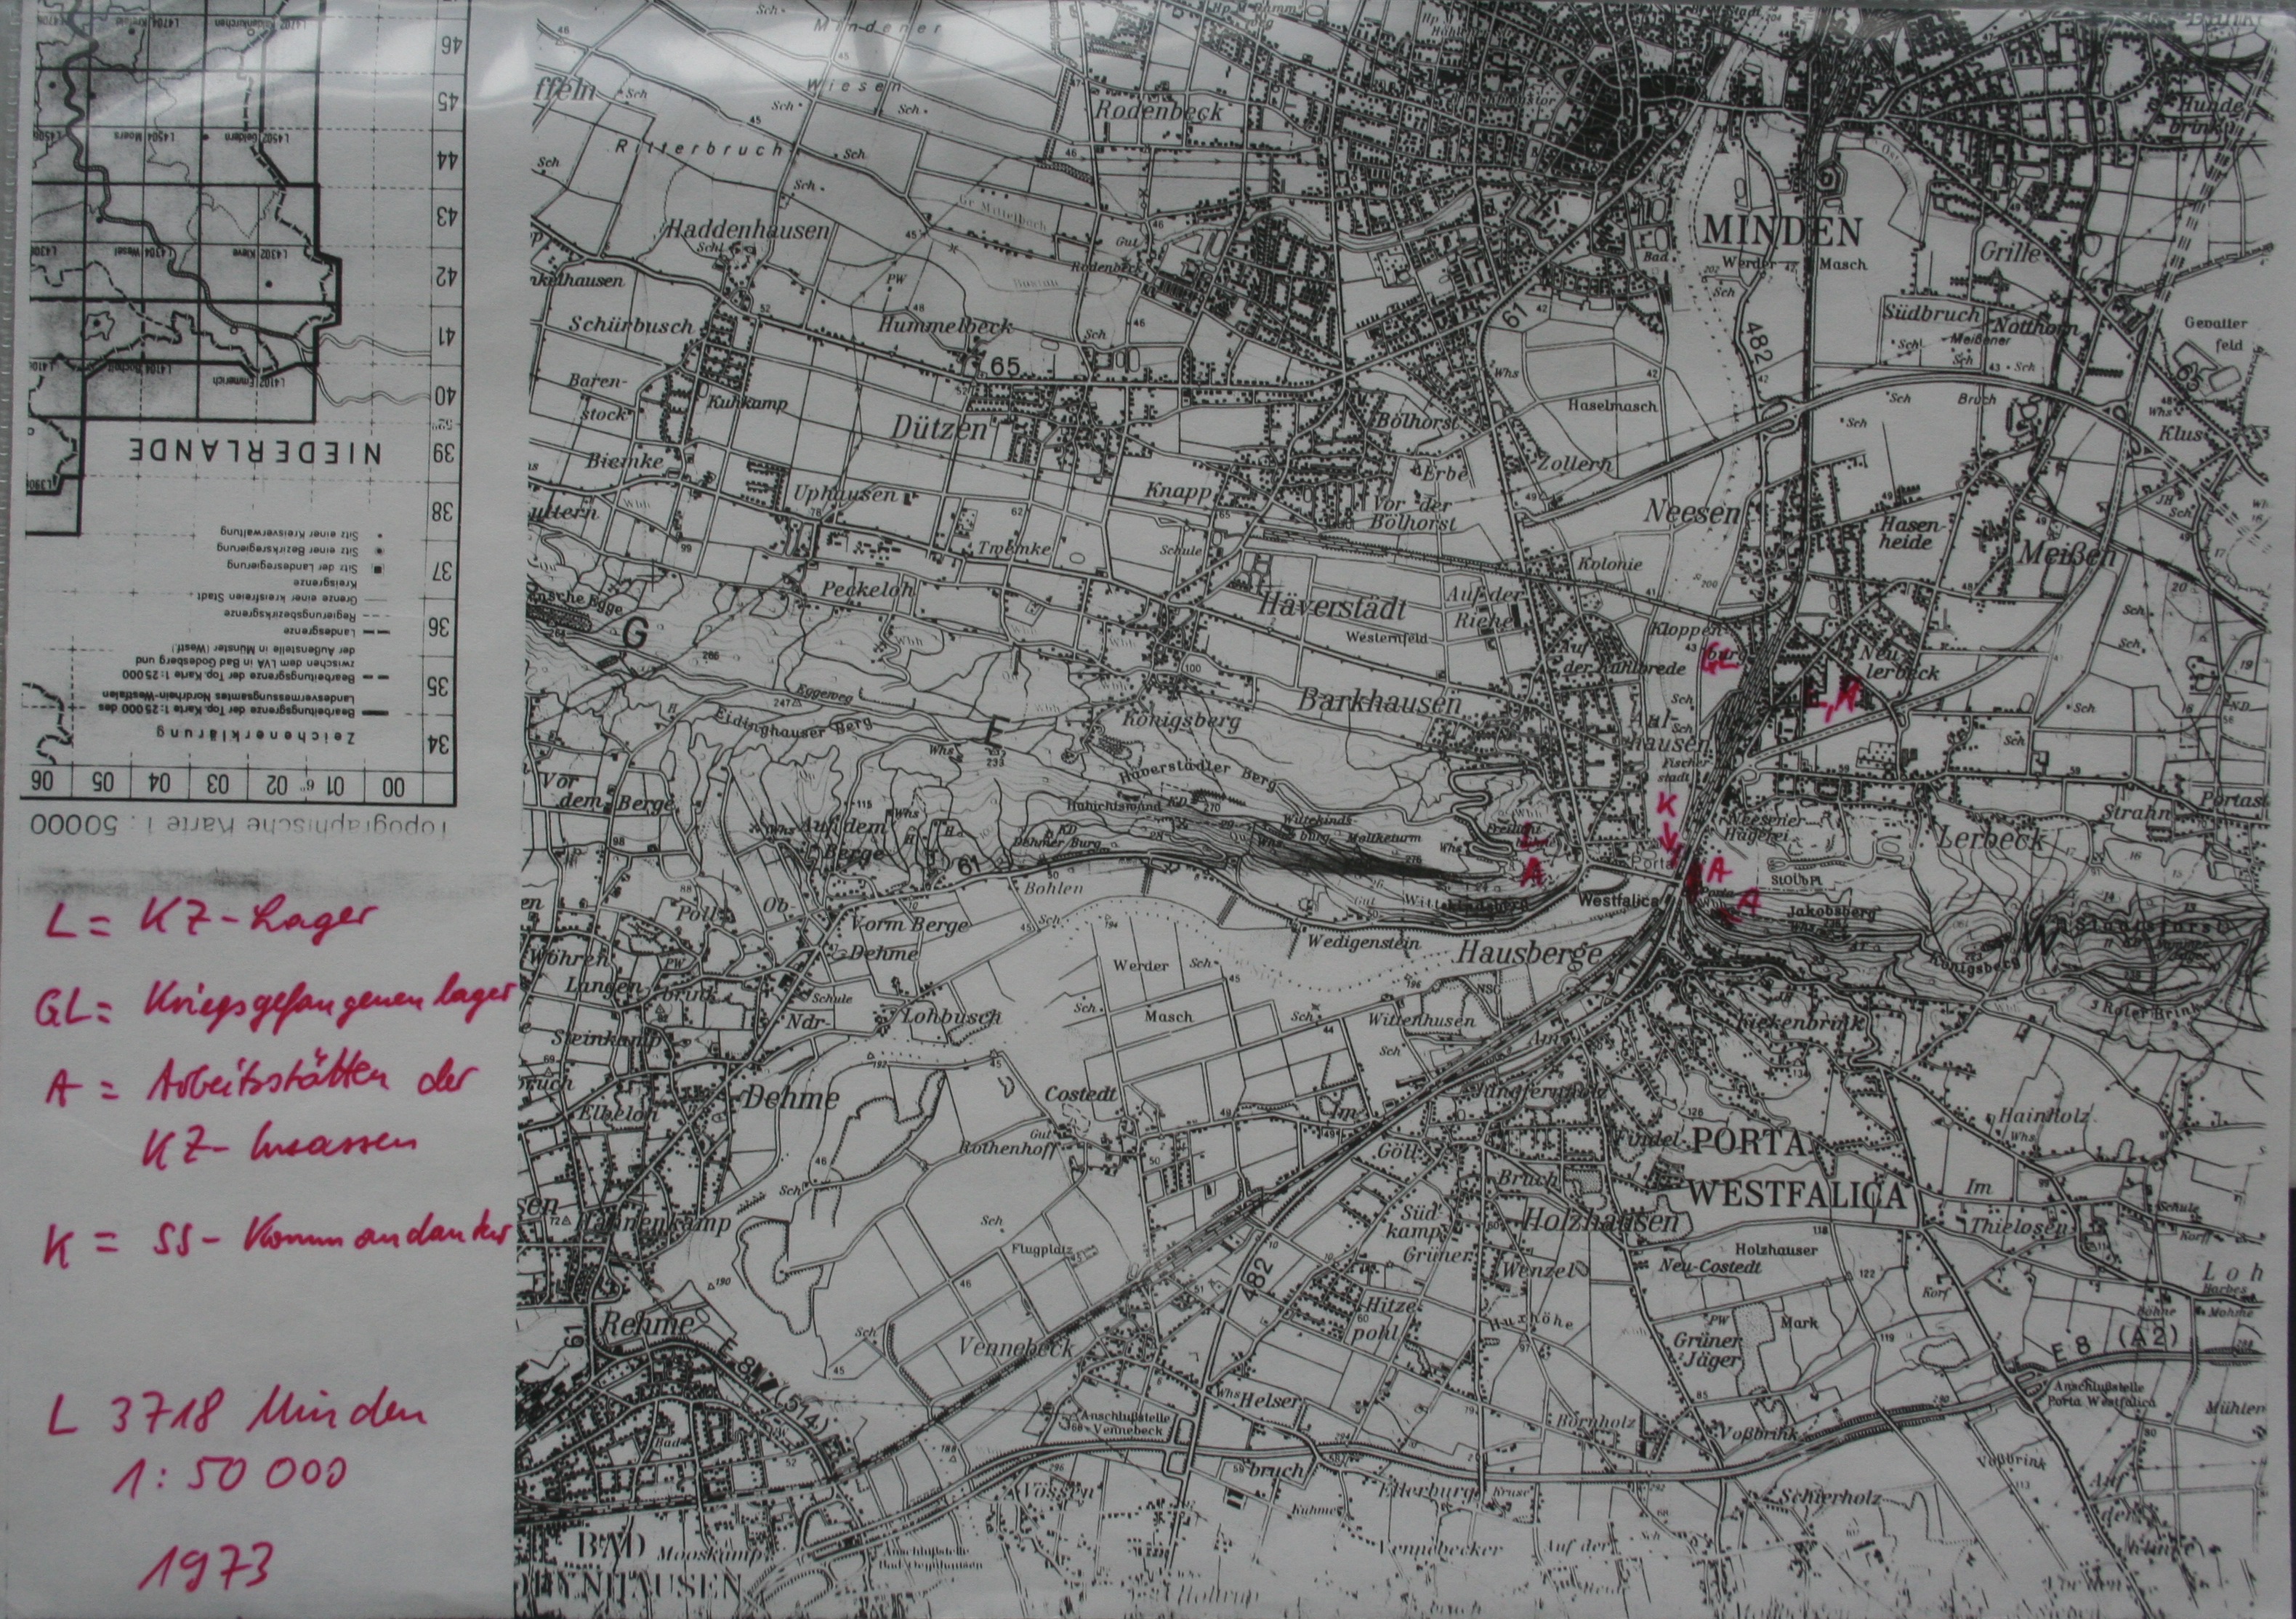
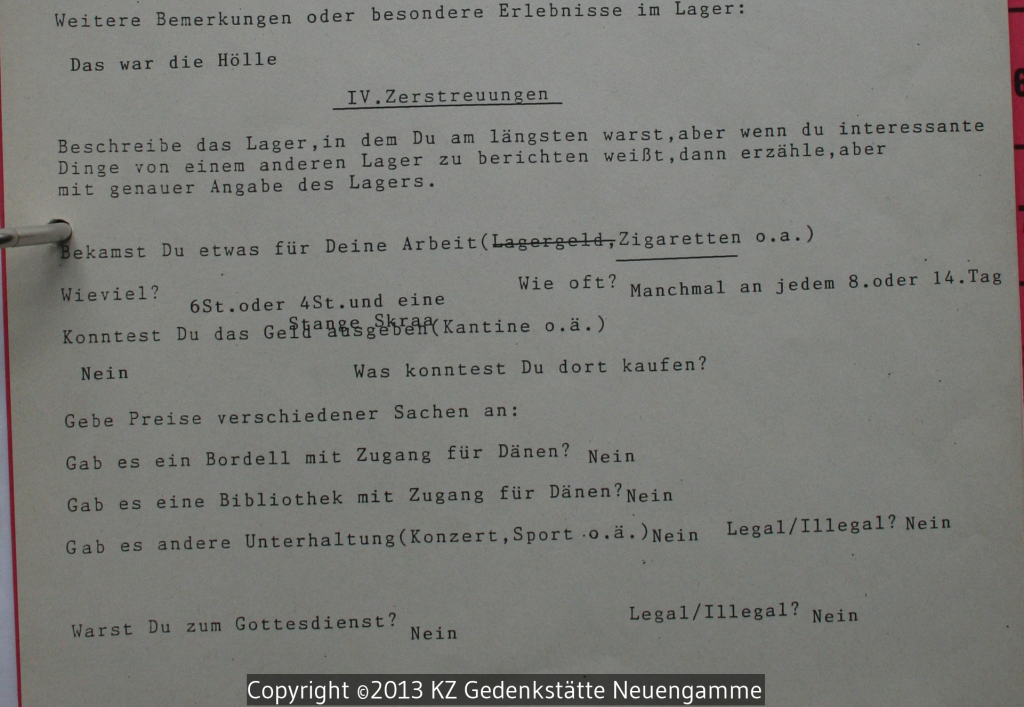
The process of writing actually begins while reading through books and looking at original source documents. For each source (whether book, document, image, or web page) I create an entry in Zotero. With an entry in Zotero, I create a child-note for that entry and take notes in that child-note. I always include the page number in the notes for easy referencing later. A typical note for an entry in Zotero looks like this:

Kaj Björn Karbo (July 4, 1920)

{ | Karbo, 1947 | | |zu:312:A6J3JADD} 

page 1,
1400 men were supposed to wash in half and hour at 20 faucets.
Longest roll call was 4 hours because a couple of men had escaped.

page 2,
Relationship to Kapos was bad, also to Russians, and somewhat so to other nationalities.
Kapos were German, Russian, Polish and Czech

page 3,
Punishments consisted of beatings with boards from a bed and truncheon. 
Stretched over a bench and held by four men and then beat

page 4,
Was part of many different work commands. In January 1945 was Schieber, 
the lowest rung of prison hierarchy. He was in charge of a 16 man work 
gang. they helped German civilian workers build a factory for synthetic fuel.

The part in curly braces { | Karbo, 1947 | | |zu:312:A6J3JADD} comes in handy later when adding citations in Scrivener.

Compose it

With all of the notes taken (for now, it can be a never ending process), copy and paste the relevant notes in the correct section of the Scrivener outline. Basically, each idea gets its own ‘page’. This boils down to each paragraph, more or less, on its own ‘page’.

Export it

First step is to export the chapter from Scrivener.

  • Export it as the OpenOffice (.odt) format. Give it a name like chapter2.odt.

Scan it

To get the footnotes into the correct format (MLA, Chicago, etc), we’ll scan the .odt file with Zotero. This creates a new file.

  • Open Zotero, click the gear, and select ‘RTF/ODF Scan’.
  • Select the file you created above (chapter2.odt).
  • Create a new name and place to save it (chapter2-citations.odt)

Cite it

The Zotero scan converts all of the coded citations from Scrivener into ‘normal’ citations.

from this: { | Blanke-Bohne, 1984 | p. 16 | |zu:312:KMQEIBU0N}

to this: Blanke-Bohne, 1984.

To get it into a different citation style, we’ll open up the file in LibreOffice and change the citation style using the Zotero ‘Set Document Preferences’ menu.

from this: Blanke-Bohne, 1984.

to this: Blanke-Bohne, Reinhold. "Die unterirdische Verlagerung von Rüstungsbetrieben und die Aßuenlager des KZ Neuengamme in Porta Westfalica bei Minden." Dissertation, University of Bremen, 1984.

After the changes finish (could take a while), then save the document as a Word, make sure to do a ‘Save As’ .docx file (chapter2-citations.docx).

Fix it

Only the .docx format is supported by pandoc for extracting images, so we’ll need to use Word as the final format before converting to Markdown and HTML. Frankly, it also has much better grammar and spell checking.

Open the .docx in Microsoft Word and fix up any formatting issues.

I also turn this version in to my advisors for review.

Convert it

In the terminal, we’ll use the pandoc command to convert the file to Markdown and HTML.

This will convert the .docx file to a markdown file, extracting the images and putting them in a ‘files/media/’ directory.

The images are named incrementally in the order they are encountered in the document. The images are given a default name, keeping the extension. If I had four images in the file (two jpegs, one png, and one gif), they would be extracted and named like so: image1.jpeg, image2.jpeg, image3.png, image4.gif, etc.

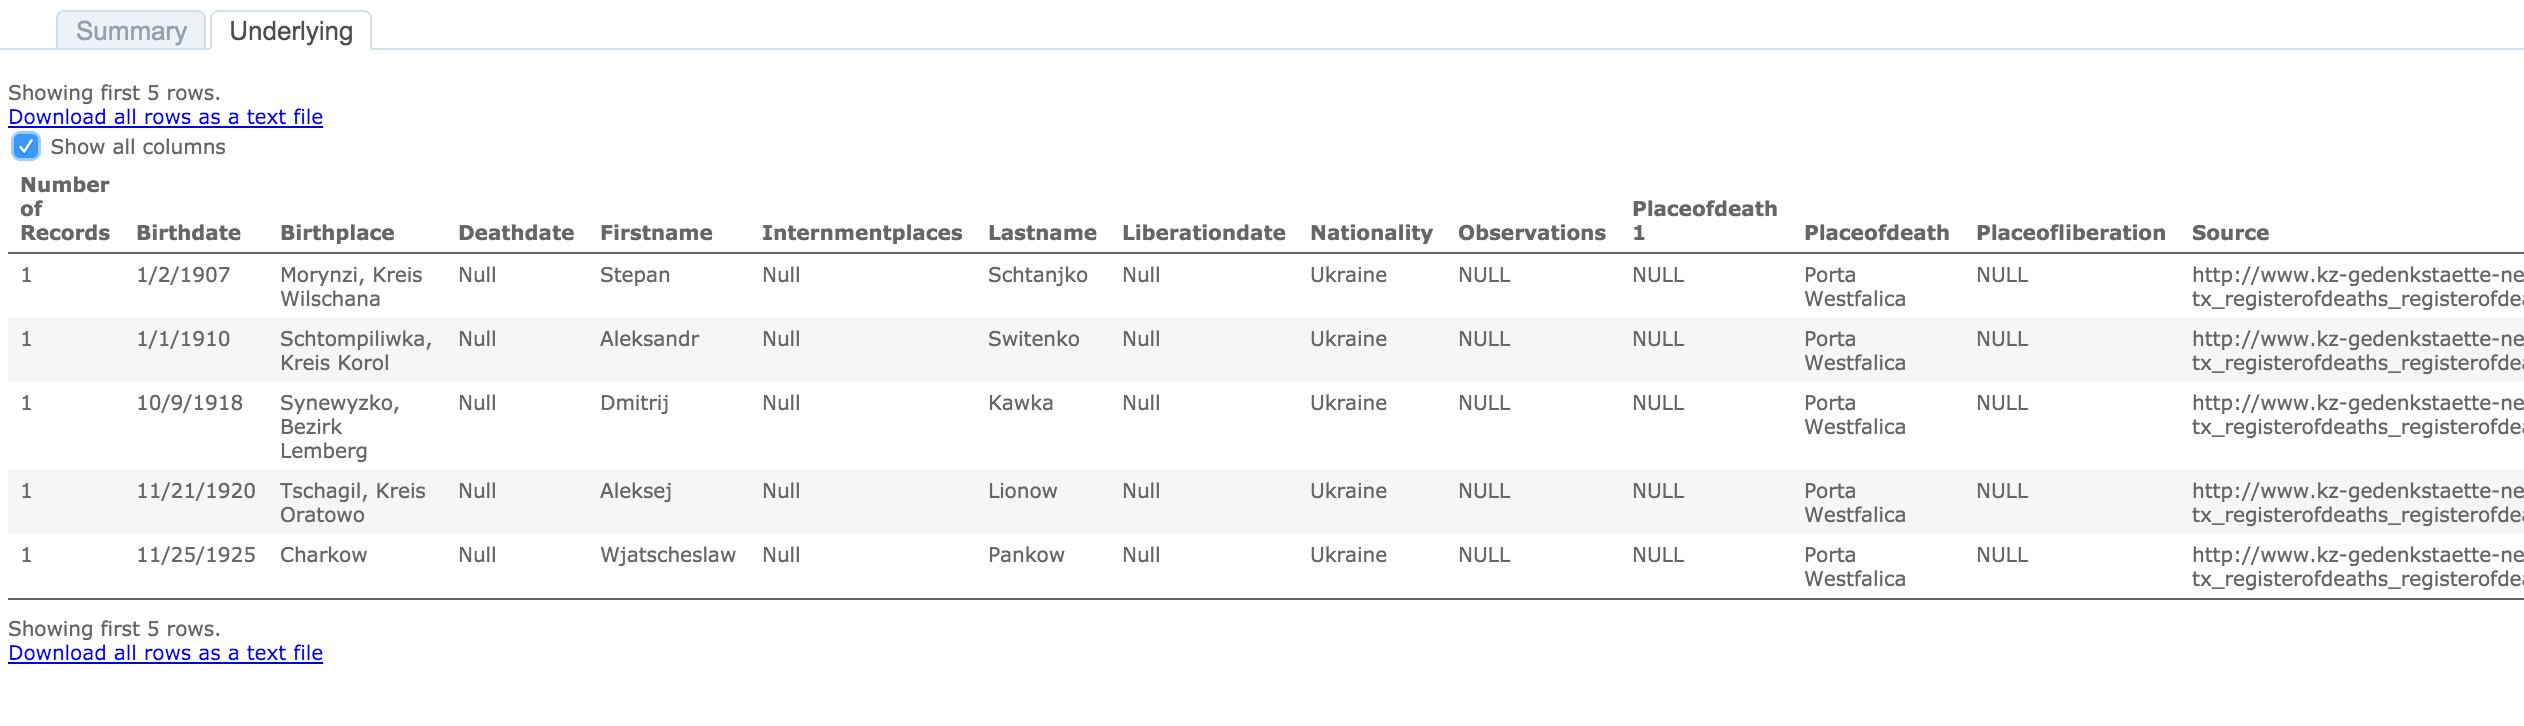
We’ll have to go in and fix the tables and check for other formatting issues.

pandoc --smart --extract-media=files -f docx -t markdown_github chapter1-citations.docx -o chapter1.md

Next we can create an HTML file using pandoc and the .docx file.

pandoc --smart --extract-media=files --ascii --html-q-tags --section-divs -f docx -t html5 chapter1-citations.docx -o chapter1.html

This creates an HTML file with the images linked to the files in the files/media/ directory and the footnotes converted to hyperlinks.

Version it

Now these files can more easily be tracked with a versioning system, like git, and the HTML files can be uploaded for a static website version of the
dissertation. Styling can easily be applied if used in a Jekyll site.

For sharing on Github, there are two repos, main and gh-pages.

main repo

The main repo is simply the chapter directories with each of the document versions and the extracted media files. Once edits and conversions are done, this is updated with a simple

git add .
git commit -m "Updates chapter X"
git push

gh-pages repo

The gh-pages repo contains the files needed to convert the html version of the doucments into a Jekyll based static website. The trick here is to get all of the updates from the main repo into this gh-pages repo. This is accomplished with doing the following command while checked out in the gh-pages branch.

```
git checkout master -- chapterX
```

Before I can push the new changes to Github, I’ll need to fix a few things in the html version of the chapter.

First is to add some YAML front matter. I add this to the beginning of the HTML version.

---
layout: page
title: Chapter X
---

Second, update the path for the images so that they will work. I open the file in Vim and do a simple search and replace:

:%s/img src="files/img src="..\/files/g

Now I can update the gh-pages branch and the site.

git add .
git commit -m "Add updates from chapterX"
git push

Locating WW2 map coordinates

I was looking through some after action reports from the U.S. military groups that entered the Minden, Porta Westfalica area in early April 1945. The reports come from 5ad.org, an unofficial site dedicated to the 5th Armored Division in WW2, and the Combined Arms Research Digital Library (http://cgsc.contentdm.oclc.org/cdm/landingpage/collection/p4013coll8). The best find so far was the map showing the path of the 5th Armored Division as they swept through Germany.

I was hoping to get information about the discovery of the underground factories, but the detail, so far, has been at a much higher level… this company moved here at this hour, and this company here, etc.

It was interesting to mentally plot the course of these military groups as they approached and left the area I was interested in. For the most part, I could just type the town’s name into Google Maps to pull up the location, but I noticed what seemed like coordinates listed sometimes as well.

That got me curious to see if there was a way to locate these coordinate points. I searched Google for “ww2 german map coordinates” which led me to this post (http://forum.axishistory.com/viewtopic.php?t=158724) at the the forums at axishistory.com, which led me to this site (http://www.echodelta.net/mbs/eng-welcome.php) that converts old ww2 coordinates to locations in Google Maps.

The system in use at the time uses a grid over northern Europe with a letter pair to distinguish each grid square. Within that square, a set of numbers determine the kilometers on the x and y axis to travel to reach the correct point. I had to guess which grid was used, since the coordinates were just numbers. It worked out well.


Methodology of a visualization

Introduction

Visual representations of data offer a quick way to express a lot of information. As the old adage goes, a picture is worth a thousand words. One of the facets of digital humanities research is providing information in the form of visuals: graphs, maps, charts, etc.

I was already writing up some notes on a visualization I was creating for the dissertation when I read this excellent blog post by Fred Gibbs (a version of a presentation at the AHA 2015). In this essay I think Fred accurately identifies the digital humanities field as one in need of stepping up to the next level. It is no longer enough to present visuals as humanities research, but it is time to start critiquing what is presented, and for researchers to start explicitly explaining the choices that went into creating that visualization.

With those thoughts in mind, I present the methodology, the decisions, and the visualization of over 200 deaths at the KZ Porta Westfalica Barkhausen, during a one year period.

A change is happening (at least for me) in how data is analyzed. I have a spreadsheet of over 200 deaths, with various information, death date, location, nationality, etc. The desire to create a visualization came from wanting to understand the data and see the commonalities and differences. The first question I had was how many nationalities are represented, and which countries. The second question is what is the distribution of the deaths by month.

The following is how I came to a visualization that answers the first question.

Data Compilation

Data is taken from two locations and merged.

  • The first set of data is a large spreadsheet obtained from the KZ Neuengamme Archiv containing all of their data on the prisoners that died and were at KZ Neuengamme or one of the satellite camps. This file contains 23,393 individuals.
  • The second data set is another set of files from KZ Neuengamme Archiv, but is derived from a list compiled by French authorities. It is available online at: http://www.bddm.org/liv/index_liv.php. The files were split into three sections listing the dead from Barkhause, Porta Westfalica, and Lerbeck. These files contained a total of 177 individuals.

Combining just the individuals matching those who were in a Porta Westfalica KZ from both sets of data left around 280 individuals.

Data Cleaning

There were a number of steps needed in order to have useful information from the data.

  • First of all, the data from the French archive was highly abbreviated. For example, the column containing the locations of internment were two or three letter abbreviations of location names. Elie Barioz, for example, had the locations “Wil, Ng (Po, Bar)” which, when translated, turn into “Wilhelmshaven, Neuengamme (Porta Westfalica, Porta Westfalica-Barkhausen)”
    • The process of translating the abbreviations was quite labor intensive. First, I had to search on the French site for an individual: http://www.bddm.org/liv/recherche.php
    • Search for ‘Barioz’. image-of-searchingNote: The Chrome web browser can automatically translate the pages on this site.
    • The correct individual can be determined by comparing the full name and the birthdate. The citation to the location in the book is a hyperlink to that record (ex. Part III, No. 14 list. (III.14.)).image-of-matches
    • The abbreviations for this individual’s interment locations are hyperlinks to more information, part of which is the full name of the location. Clicking on ‘Wil’ results in a pop up window describing the KZ at Wilhelmshaven and information about the city.
      image-location-pop-up
    • After determining that ‘Wil’ meant ‘Wilhelmshaven’, all occurrences of ‘Wil’ in that column can be changed to ‘Wilhelmshaven’.This process is repeated until all of the abbreviations have been translated.
  • Remove extraneous asterisks. It was quite frustrating to note that the French site did not include information on what the asterisk and other odd symbols mean. (Another odd notation is the numbers in parenthesis after the birth location.) I had to simply just delete the asterisks, losing any possible meaning they might have had.
  • Combine duplicates. Keep as much information from both records as possible.
  • Fix dates. They should all be the same format. This is tricky, in that Europe keeps dates in the format MM-DD-YYYY. For clarity sake, it would be best to use “Month DD, YYYY”. I left them as is for now. Editing 280 dates is not fun…
  • Fix nationality. The Tableau software references current nations. The data in the spread sheets uses nations current to the time of creation. For example, some individuals were noted with the nationality of ‘Soviet Union (Ukraine)’. These needed to be brought to the present as ‘Ukraine’. More problematic were the individuals from ‘Czechoslovakia’. Presently, there is the Czech Republic and Slovakia. The question is, which present day nationality to pick. There is a column for birth place which potentially solves the issue, but this field is for where the individual was born, wich, in the case of Jan Siminski, is seen. He was born in the Polish town of Obersitz (German translation), so the birth place can not clarify his nationality as Czech or Slovakian.
  • This brings up another issue, the translation of place names. City names in German, especially during the Third Reich, are different than current German names for the city, which are different than the English name of the city, which are different than what the nation calls the city. I need to standardize the names, picking, probably English. Tableau seemed to have no problem with the ethnic city names, or the German version, so I left them as is.


Tool Picking

I used the free program, Tableau Public: http://www.tableau.com/

This allows for very quick visuals, and a very easy process. The website has a number of free tutorials to get started. http://www.tableau.com/learn/training

Map

The first visualization I wanted to make was a map showing where the prisoners were from, their nationality. The map would also show the number of prisoners from each country. (This is not a tutorial on how to use Tableau, but a walk through of the pertinent choices I made to make sense of the data, it is methodology, not tech support. 🙂 )

Using the default settings (basically, just double clicking on the Nationality field to create the map) results in a dot on each country represented in the data.

image-blue-dots-map
This can be transformed into a polygon highlight of the country by selecting a “Filled Map”.

image-filled-map
Next step was to apply shading to the filled map; the larger the number of prisoners who died from that country the darker the fill color.
image-filled-map
The default color was shades of green. I wanted a more dull color to fit in with the theme of the visualization, “death”. I picked a light orange to brown default gradient, separated into 13 steps (there are 13 countries represented).

Table

While just a filled map with gradient colored countries is helpful, the information would be more complete, more fully understandable, with a legend. This can be created by using a plane table listing the countries and the number of dead from that country. Each row is color coordinated with the map by using the same color scheme and number of steps as with the map.

image-table


Dashboard

In Tableau, you create a dashboard to combine the different work sheets, maps, tables, graphs, etc. In this case, a full page map, with the table overlaid completes the visualization.

Result

The result is a very simple map, created in about ten minutes (after a few video tutorials to refresh my memory on how to create the affects I wanted).

(See a fully functioning result below this image.)
image-final-result


Benefits of Tableau

Tableau has some limitations. The results are hosted on their servers, which has the potential for lock down. They use proprietary, closed source code and applications.

But there are many benefits. The default visualizations look great. It is very easy to create simple and powerful visualizations. The product is capable of producing very sophisticated statistical representations. You can use the free and open source stats program R. The visualizations are embed-able in any website using Javascript.

The biggest benefit of using Tableau is the automatic link back to the original data source. I think the most needed shift in humanities (particularly the history profession), and the biggest benefit of “digital” capabilities for the humanities, is the ability to link to the source material. This makes it infinitely more easy for readers and other scholars to follow the source trail in order to provide better and more accurate feed back (read critique and support).

To see the underlying data in this visualization, click on a country in the map or the table. A pop up window appears with minimal data.

image-pop-up-info

Click on the “View Data” icon.

image-view-data-icon

Select the “Underlying” tab and check the “Show all columns” box. Voilà!

image-underlying-data

Behold the intoxicating power of being able to view the underlying data for a visualization!

Digital Humanities Improvement Idea

Imagine, if you will, the typical journal article or book, with footnotes or end notes referencing some primary document or page in another book or article. With digital media, that footnote turns into a hyper-link. A link to a digital copy of the primary document at the archive’s site, or the author’s own personal archive site. Or it links to a Google Book site with the page of the book or journal displayed. Now you have the whole document or at least a whole page of text to provide appropriate context to citation.

Way too often I have been met with a dead end in following citations; especially references to documents in an archive. Not often, but archives change catalog formats, documents move in an archive, they no longer are available to researchers, etc. It would be so much easier to have a link to what some researcher has already spent time finding. Let’s build on the shoulders of each other, rather than make each scholar waste time doing archival research that has already been done.

I think it incumbent upon all researchers to provide more than a dead-text citation to their sources. In this digital age, it is becoming more and more trivial to set up a repository of the sources used in research, and the skills needed to provide a link to an item in a repository less demanding. Here are some ideas on how to accomplish this already.

  • Set up a free, hosted version of Omeka at http://omeka.net. Add all of your source material to Omeka. Provide a link to the document in Omeka along with your citation in the footnote or end note.
  • Create a free WordPress account at http://wordpress.com. Add a post for each source document. Provide a link to that post in your citation.
  • Most universities have a free faculty or student web hosting environment (something likehttp://univ.edu/~usrname/). Dump all of your digital copies of your documents in that space (nicely organized in descriptive folders and with descriptive file names–no spaces in the names, of course). Now, provide a link to that resource in your citation.
  • Set up a free Zotero account at http://zotero.org. Set up a Group Library as Public and publish all of your sources to this library.

I intend to take my own advice. I have an Omeka repository already set up, with a few resources there already: NaziTunnels Document Repository. Once I start publishing the text of my dissertation, there will be links back to the primary document in the footnotes.

I would love to see this type of digital citation become as ubiquitous as the present-day dead-text citation.

I have not addressed Copyright issues with this. Copyright restrictions will severely limit the resources to be used in an online sources repository, but there are certainly work ways to work around this.

If hosting the sources on your own, one quick fix would be to put the digital citation sources behind a password (available in the book or journal text). Another option might be to get permission from the archive if only low quality reproductions are offered.

End

Let me know if you find the live-text or digital citation idea viable. Do you have other ideas for providing a repository of your sources?

Drop me a note if you want more detail on how I created the map in Tableau. I’m by no means proficient or in no way the technical support for Tableau, but I’ll do what I can to guide and advise.

Designing the Website

There are many, many, many, many web sites, tutorials, how-tos and printed pages written on how to create a website; the proper steps needed, the best way to design, the best place for hosting, and on and on. Well, here’s another one…

Hopefully this reaches a different audience and provides insight and help along the way.

Additionally, this post is part of the dissertation. Of the How, What and Why of the website, this post explains the How. So this post is less a how to do it for you, but an explanation of what I did, as part of the methodological approach to digital humanities section of the dissertation.

Content is King

The absolute most important thing for a website to be relevant and useful is to have pertinent and quality content. Many ugly and difficult to use sites exist and are frequently used because they have important and relevant content. A simple web search turns up hundreds of articles addressing the need to put content first. Links to such articles are almost pointless in that new articles are written constantly. Nevertheless, here is a great article stressing that generally the most important step is to define the content, then create the HTML structure, and then finally design the website. By “content” what is really meant is what kind of content types are used in the website, not finished and edited prose, images or video. “Content” means structure, as argued by Mark Boulton. In reality, “content” influences design, and design influences content, but in general, it is important to know what types of content are to be used on the site first. Below I describe four content types used in the dissertation website.

The basic purpose of a website is not to support the needs of the creator, but to answer the users question. A user comes to a website looking for information or an answer to a problem or question. If that answer is not found, they will go looking elsewhere.

With that thought in mind, I looked at all of the information and content that I have and tried to figure out what the website visitors would most want. The purpose of the site is to be a repository of documents and information about the underground dispersal projects, so that information and those documents are the most important pieces of content.

The site also contains essays (discourses/chapters/treatise/monograph/disquisition/paper, whatever they be called) about German and English morale during the bombing wars, the interaction of German businesses with the Nazi government, the reason why some businesses were moved underground in the first place, a discussion about the merits of a digital dissertation over a traditional written narrative dissertation, a summary and analysis of the underground project at Porta Westfalica, and an analysis of a digital project that maps the location of events for numerous inmates at Porta Westfalica.

Another piece of content on the site are the teaching modules. These modules will help high school and undergraduate German language teachers utilize the primary sources in the repository.

Finally, the repository itself and the documents within are desirable  as content.

Through this exercise I formalized that I have four distinct types of content for the site: project information, primary documents, teaching modules, and informative and analytical disquisitions/chapters/essays.

Below is an image of my notebook brainstorming the content, structure and design of the website.

The four content types: Project pages, Repository, Essays, and Teaching Modules.

 Audience

Another key factor in designing the website emerged simultaneously with the four content types; the desired content depends on who is visiting the site.

For an example, if I were a high school German teacher looking for a way to get my disinterested kids more interested in learning German instead of throwing spit wads at the ceiling during class, then what I want when I come to the site is a ready made plan for grabbing their attention by appealing to their weird fascination with all things Third Reich (which, honestly, is probably why they are taking German in the first place). If I see a link to teaching modules, I’m sure to click it. If I see some examples of those modules I’ll be even more likely to click through.

As another example, if I am a scholar and I’m looking for documents about underground dispersal projects or letters written by Hans Kammler, then having a link to the repository makes it easy to find what I need. Again, an example of documents displayed on the page is more helpful than a link, and a search box for searching the repository directly is the most helpful of all.


Semantic Structure

Much has changed in the past few years of web development, especially with the adoption of the HTML 5 and CSS3 standards. There are now HTML tags specifically for writing, like: article, aside, figure, and figcaption. When taken seriously, HTML semantics provides for a much better web experience (especially for those using alternatives to web browsers like screen readers for the deaf) by providing a well built structure to frame the content and a scaffold upon which can hang a beautiful design. The above linked Smashing Magazine article does a great job pointing out the desirability of properly structured content.

One can think of the HTML structure of a webpage in the same way one uses an outline of an essay. The structure defines where the content goes. A great resource for understanding the HTML5 structure and elements is found at the Mozilla Developer Network site.

Fortunately, many modern content management systems take care of (or obfuscate) the underlying structure. I will try to influence the underlying HTML that WordPress and Omeka create, but as this is a historical dissertation and not a work about web standards, the end result will be something less than perfect semantic markup.


Design Matters

The way a website looks matters. Designs can make it easy or difficult to find the content. Sometimes design elements get in the way and distract from the content. There are many sites and articles dedicated to teaching you how to design a website. Companies have been formed with the goal of instructing you how to build and design websites. One favorite instruction site has been tutsplus.com which has instructions for almost anything computer related. A great online magazine that deals with modern designs in websites is the before linked Smashing Magazine. There are many, many others.

Wireframes

Any easy way to get a sense of how the different components and content types fit together is to create a wireframe. A wireframe is a very rough sketch of the website just to show how the components fit together. They may or may not include actual pieces of content. Often they contain filler text and filler images. As the name implies, wireframes are a barebones outline of how the website components fit together, much as a sketch for an artist precedes the painting.

There are many software options available for creating wireframes, each with advantages and learning curves. As a matter of practice, I used the online tool, MockFlow. The easiest method for creating wireframes is using good old paper and pencil.

I used paper and pencil or the very rough sketching, and MockFlow for a bit finer detail and included some actual content.

Navigation

Getting around the site is crucial. If a website is like a maze and clicking on links leads to loss of bearings and confusion, visitors are less likely to continue using your site and may not come back.

This site design has navigation at the top of the page that will remain in place no matter what page is being visited. Main navigation links are also found at the bottom of the page in the footer. These menu items link to the four content types; projects, repository, teaching, and essays, with links to the home page and blog/news section as well.

One goal for this site is to have all desired content available within three mouse clicks. That is, no matter what page I am currently viewing on the website, I should only have to click on at least three links to get the content that I want. The top and bottom navigation menu makes it possible to get to the four main content pages with one click. A second click brings me to an individual project page, a specific disquisition (essay), or a lesson plan. Similarly, using the search tool allows me to view a list of repository items in one click, and view the item (if the item is on the first page of results) on the second click.

A Map of KZ Porta Westfalica

I needed to get the latitude and longitude of several places for the GIS project. I used Google Maps to get the data. Just click on a point on the map and the info box shows you the lat/long.


GoogleMaps-LatLong

While playing with this, I figured I’d make a more permanent map showing some of the important locations. That map is found here:

https://www.google.com/maps/d/edit?mid=zuMewFpePmAg.kUArQ9EReKT4

Map-with-locations

I was able to find the locations with the help of a couple of maps I found in archives.IMG_0635 copy LagerMap


The nice thing about the Google map is that it can attache photos of the points I marked (as seen in the first, feature, image).


Das war die Hölle

While reading through the survivor accounts that I gathered from the Neuengamme Concentration Camp Memorial last summer, I found a unique report. Apparently at one time either the Danish government, the National Museum in Copenhagen, or the Freedom Museum in Copenhagen put out a survey to former concentration camp inmates.

Axel Christian Hansen was one such inmate. Born in 1899, he was captured in Denmark as a political dissident on September 30, 1944. Sent first to Neuengamme, he was then sent to Porta Westfalica on October 3. His answers are terse, yet convey much; as do the questions left unanswered. Here are a few of the questions and his answers. The survey was conducted in Danish on an unspecified date, and translated into German in 1990.

The first section deals with his transportation from Neuengamme (near Hamburg) to Porta Westfalica.

Type of transportation: Cattle car/ passenger car/automobile/shipopen/closed

How many in each car: 50 men

Was there straw or carpet or other? No

Did you receive any rations during the trip? bread-jam-meat? No

How much?

Did you receive anything to drink? No

How did you relieve yourself? In the corner of the car.

Were there air raids? Yes

Did you stay in the cattle car? Yes

Was it locked? Yes

Where were the guards? In the first car.

Where there any dead or wounded? No

Where there any escape attempts? No

Was there any mistreatment? No

Further comments regarding the transportation and description of exceptional experiences.

There was no time to sleep in the train car because there were too many of us. When we were shipped to Porta, we were given a little bit of water and a little bit to eat from a guard.


The second part deals with the arrival in Porta Westfalica.

What did you have remaining of your things upon arrival? A belt.

Was your face or head shaved? Yes

Was your body shaved? Yes

Where you shaved in another way? Yes, with a reverse mowhawk

How often did you get a reverse mowhawk (Autobahn)? 3 times

When were you allowed to grow your hair? Never


Section three deals with daily life.

How often did you receive a change of clothes (approximate date received)? The prisoner clothes were never changed.

What was exchanged? Shirt and underpants were changed every third week.

Was there any opportunity to wash or receive washed clothing? No

What kind of shoes? Wooden shoes (clogs)

Condition of the shoes? bad

List your other personal belongings (toothbrush, soap, tissue, toilet paper, etc, and how long you had them)

How many roll calls were there per day? about 4-5

When? Mornings, evenings, middle of the night

How long did they normally last? from 1 to 3 hours

How long did the longest last? 3 hours


There is much more to be found in the document. It will be available in the document repository I am building with Omeka, where it can be translated and transcribed by anyone who wants.

Much about the camp life is known because of memoirs of the Danish political prisoners. Following are a couple of books by Danish survivors:

Kieler, Jørgen. Resistance Fighter: A Personal History of the Danish Resistance Movement, 1940-1945. Jerusalem, Israel; Lynbrook, NY: Gefen Publishing House, 2007.
Madsen, Benedicte, and Søren Willert. Survival in the Organization: Gunnar Hjelholt Looks Back at the Concentration Camp from an Organizational Perspective. Aarhus [Denmark]; Oakville, Conn.: Aarhus University Press, 1996.