Tag: archives

Methodology of a visualization

Introduction

Visual representations of data offer a quick way to express a lot of information. As the old adage goes, a picture is worth a thousand words. One of the facets of digital humanities research is providing information in the form of visuals: graphs, maps, charts, etc.

I was already writing up some notes on a visualization I was creating for the dissertation when I read this excellent blog post by Fred Gibbs (a version of a presentation at the AHA 2015). In this essay I think Fred accurately identifies the digital humanities field as one in need of stepping up to the next level. It is no longer enough to present visuals as humanities research, but it is time to start critiquing what is presented, and for researchers to start explicitly explaining the choices that went into creating that visualization.

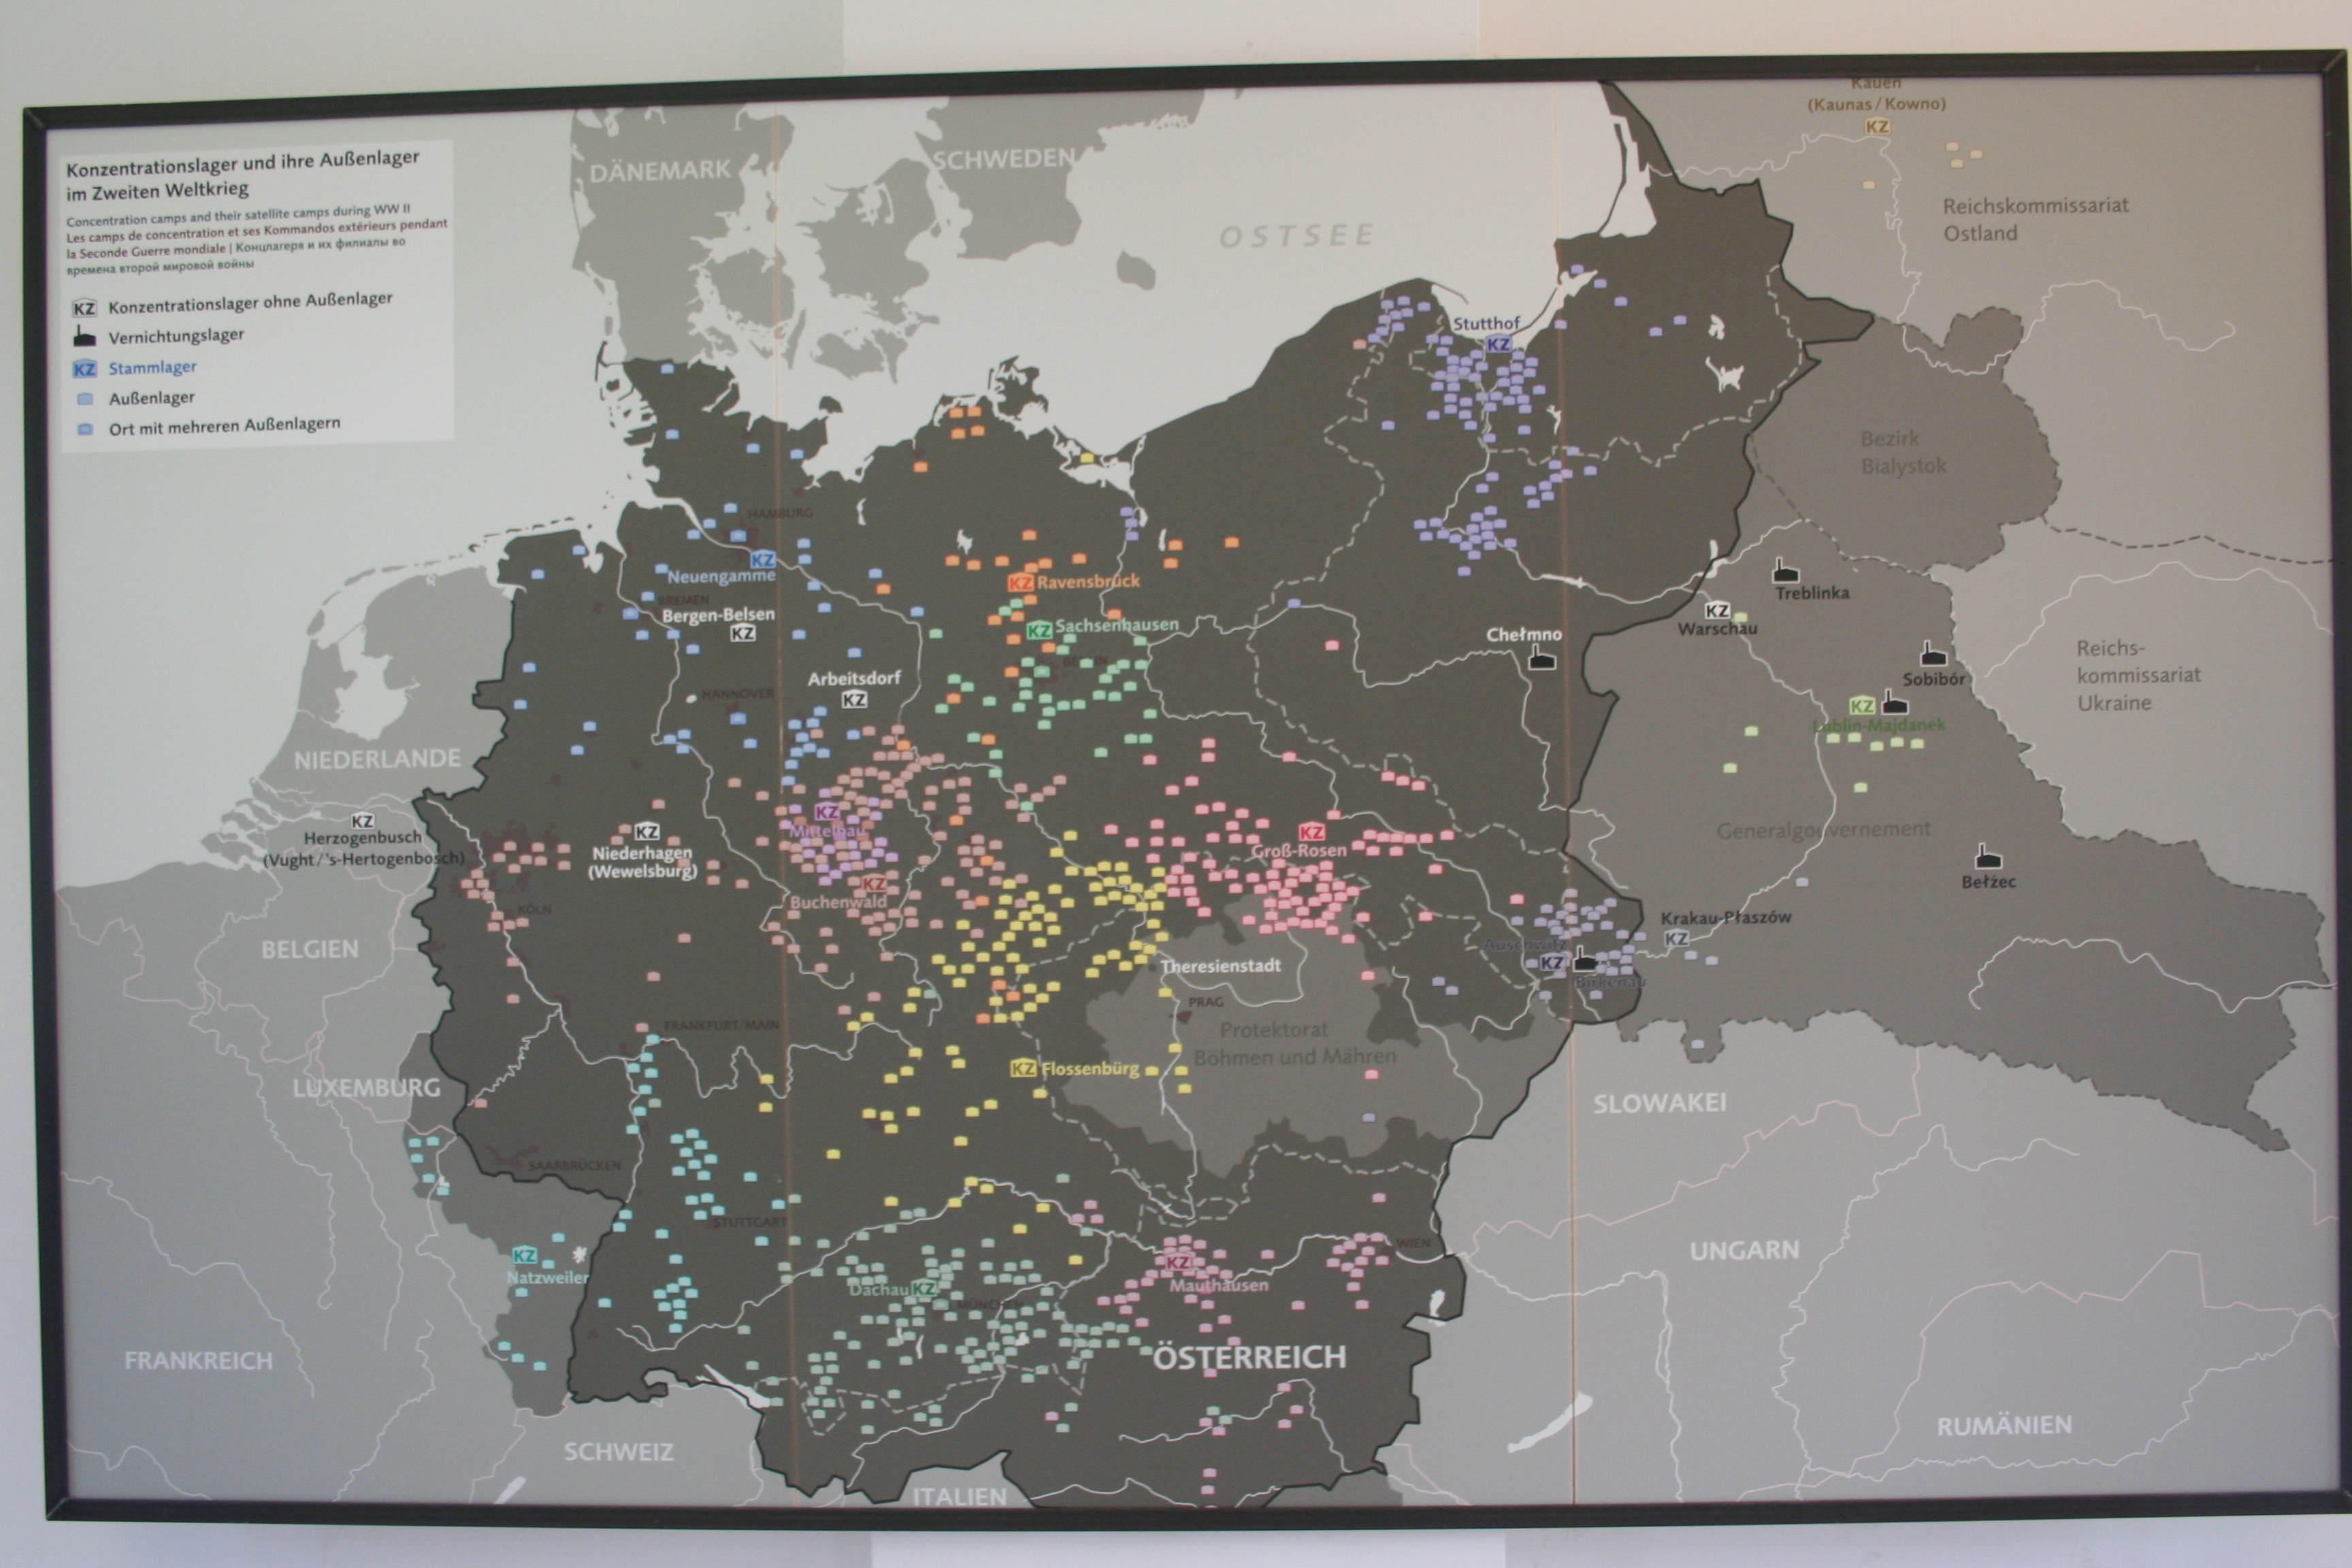
With those thoughts in mind, I present the methodology, the decisions, and the visualization of over 200 deaths at the KZ Porta Westfalica Barkhausen, during a one year period.

A change is happening (at least for me) in how data is analyzed. I have a spreadsheet of over 200 deaths, with various information, death date, location, nationality, etc. The desire to create a visualization came from wanting to understand the data and see the commonalities and differences. The first question I had was how many nationalities are represented, and which countries. The second question is what is the distribution of the deaths by month.

The following is how I came to a visualization that answers the first question.

Data Compilation

Data is taken from two locations and merged.

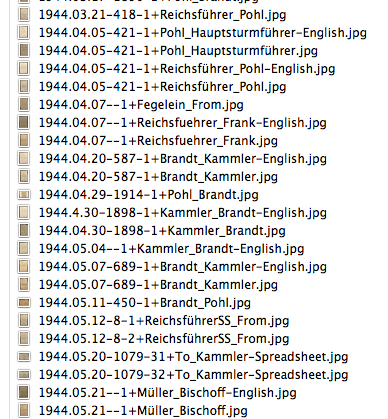
  • The first set of data is a large spreadsheet obtained from the KZ Neuengamme Archiv containing all of their data on the prisoners that died and were at KZ Neuengamme or one of the satellite camps. This file contains 23,393 individuals.
  • The second data set is another set of files from KZ Neuengamme Archiv, but is derived from a list compiled by French authorities. It is available online at: http://www.bddm.org/liv/index_liv.php. The files were split into three sections listing the dead from Barkhause, Porta Westfalica, and Lerbeck. These files contained a total of 177 individuals.

Combining just the individuals matching those who were in a Porta Westfalica KZ from both sets of data left around 280 individuals.

Data Cleaning

There were a number of steps needed in order to have useful information from the data.

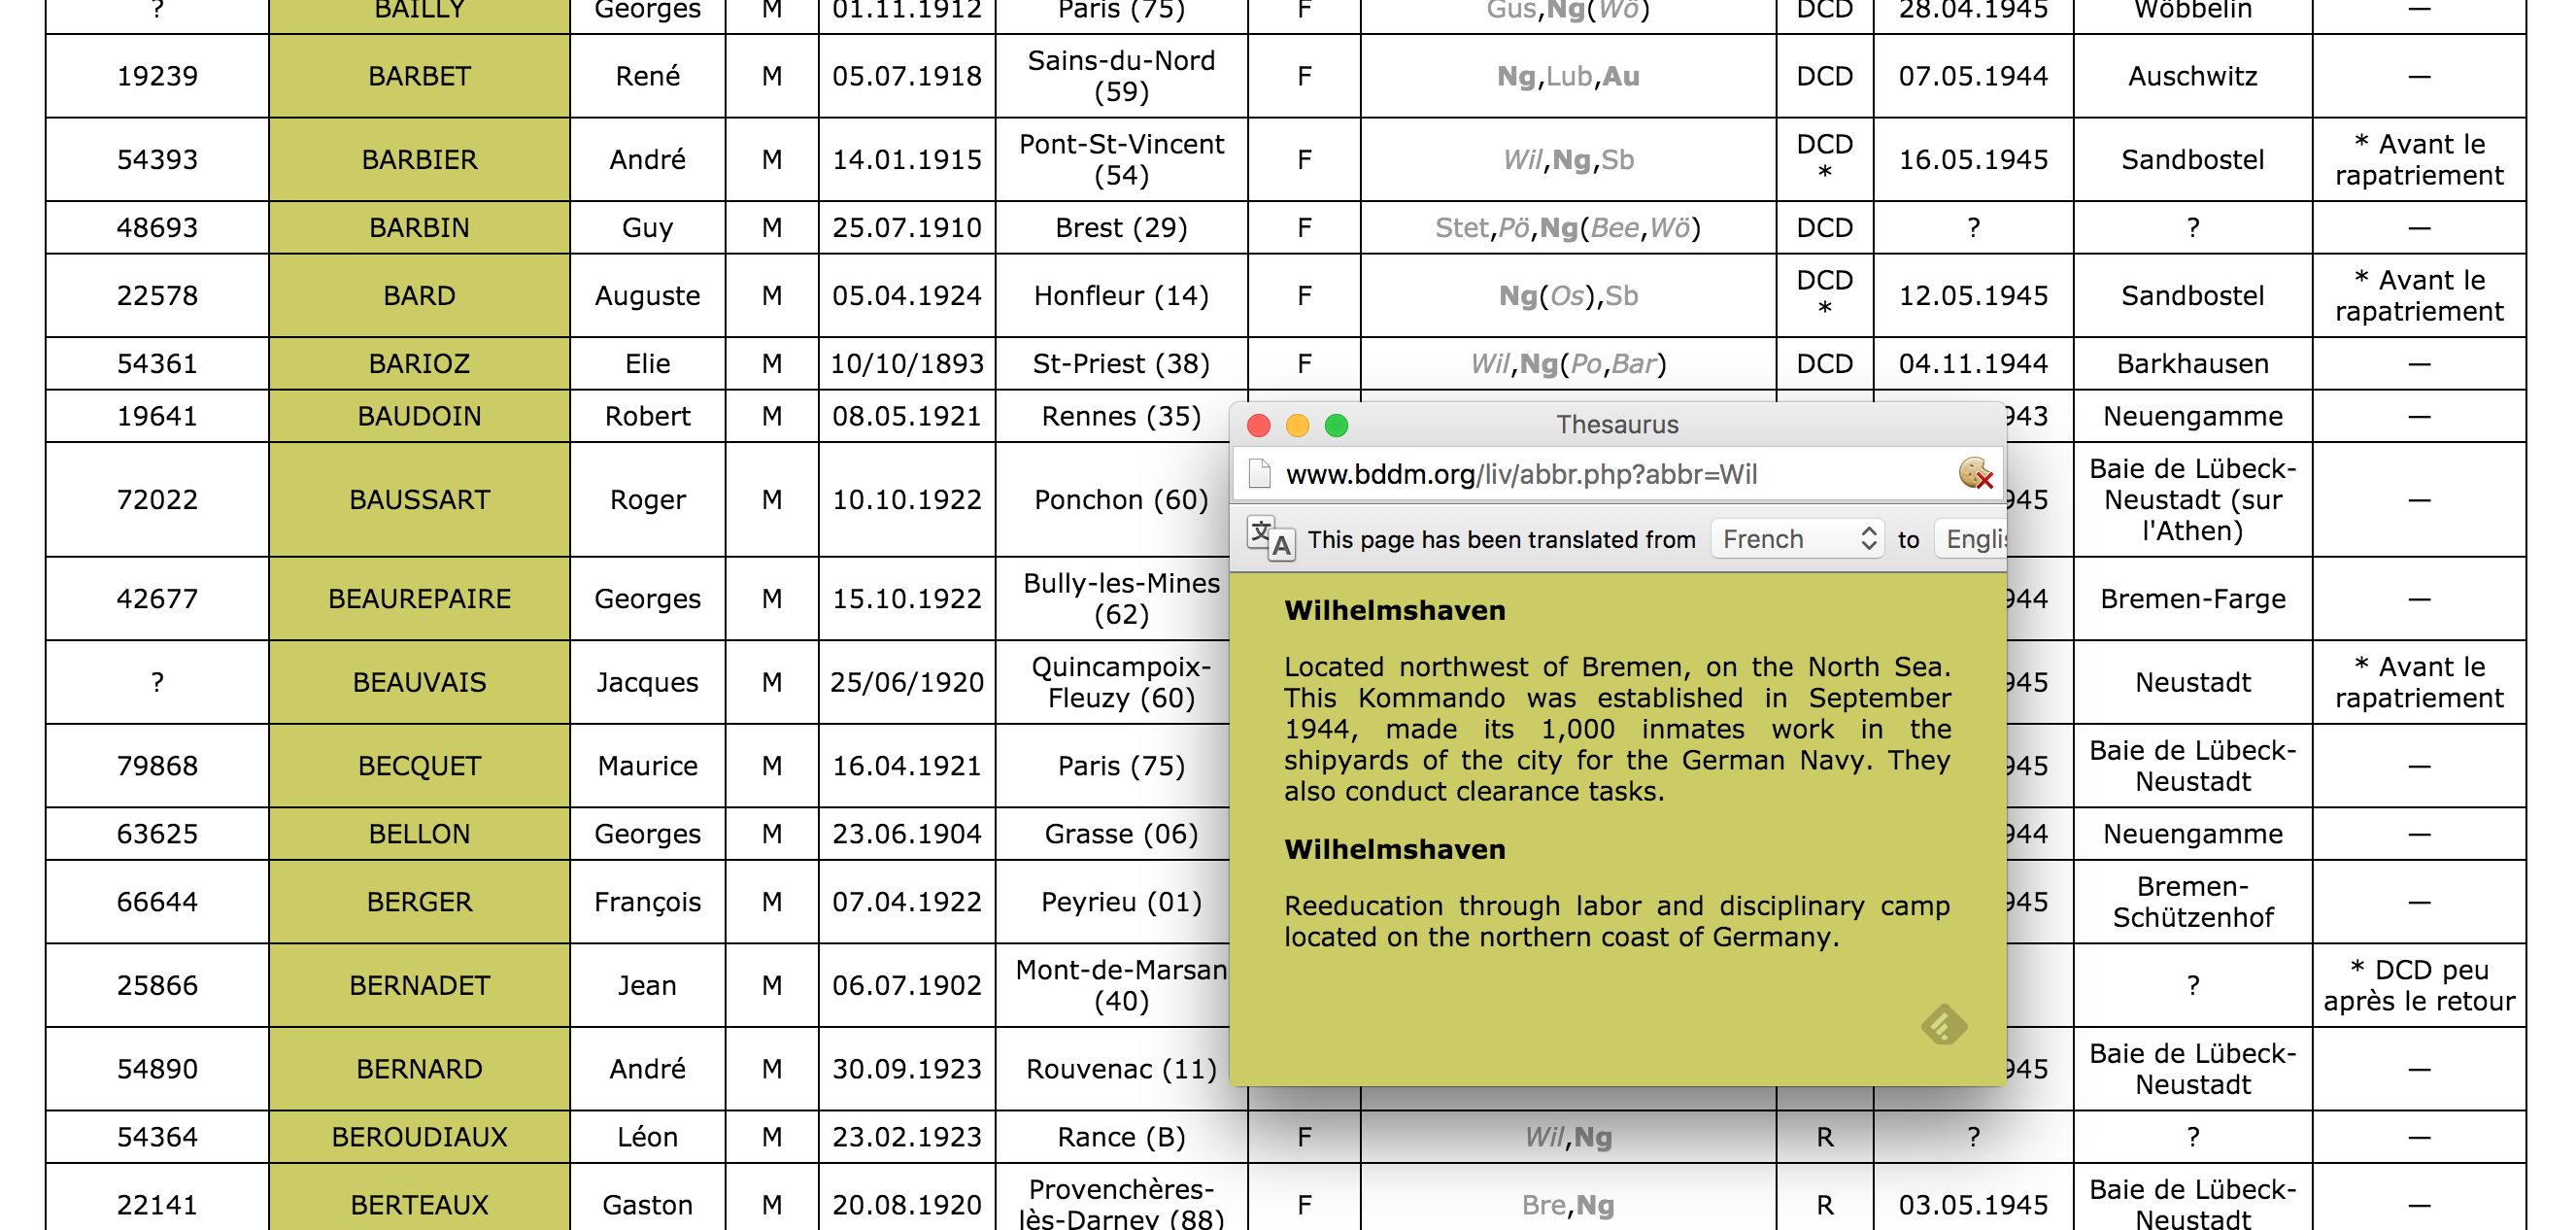
  • First of all, the data from the French archive was highly abbreviated. For example, the column containing the locations of internment were two or three letter abbreviations of location names. Elie Barioz, for example, had the locations “Wil, Ng (Po, Bar)” which, when translated, turn into “Wilhelmshaven, Neuengamme (Porta Westfalica, Porta Westfalica-Barkhausen)”
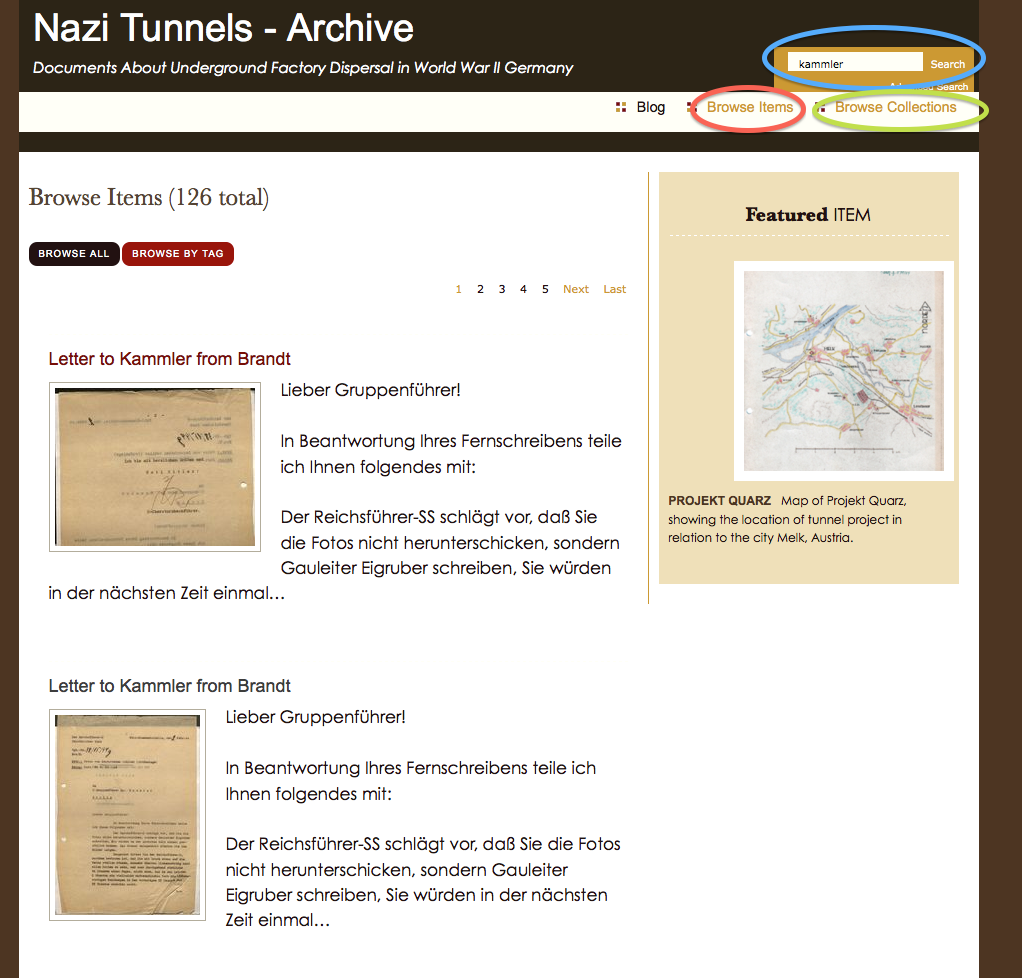
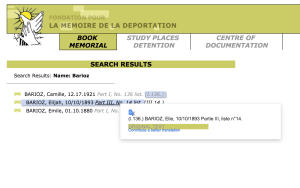
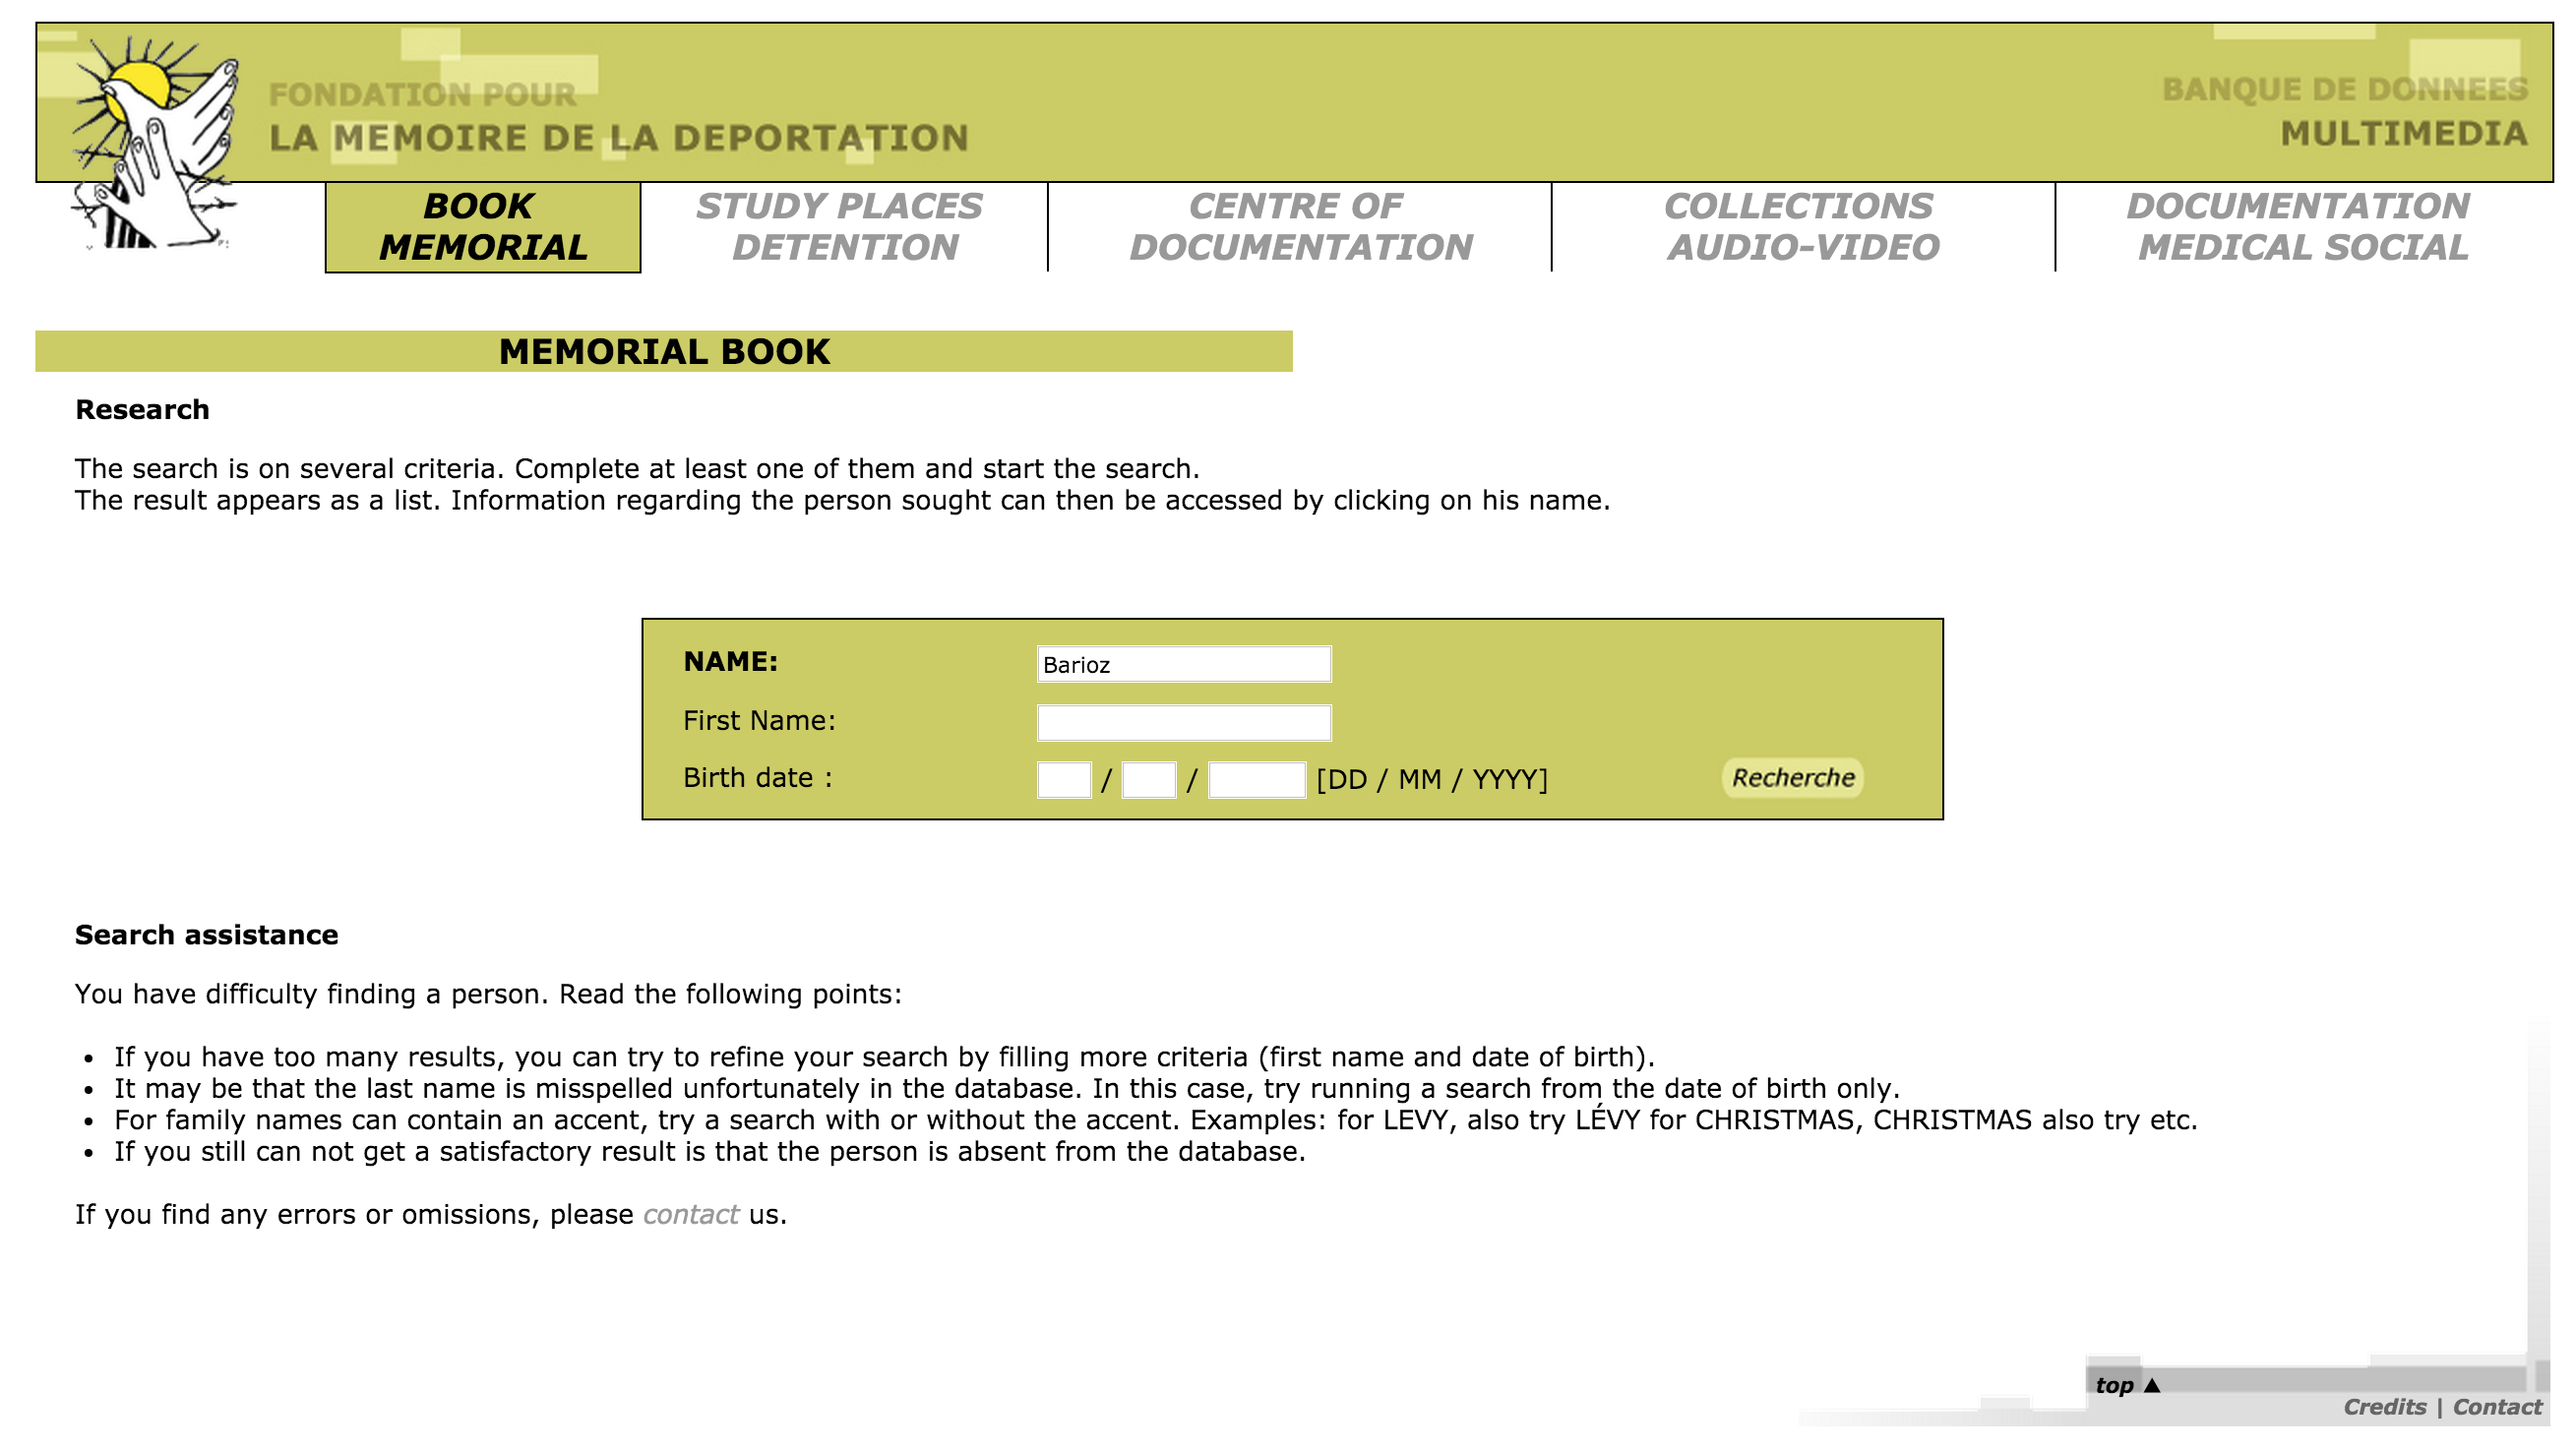
    • The process of translating the abbreviations was quite labor intensive. First, I had to search on the French site for an individual: http://www.bddm.org/liv/recherche.php
    • Search for ‘Barioz’. image-of-searchingNote: The Chrome web browser can automatically translate the pages on this site.
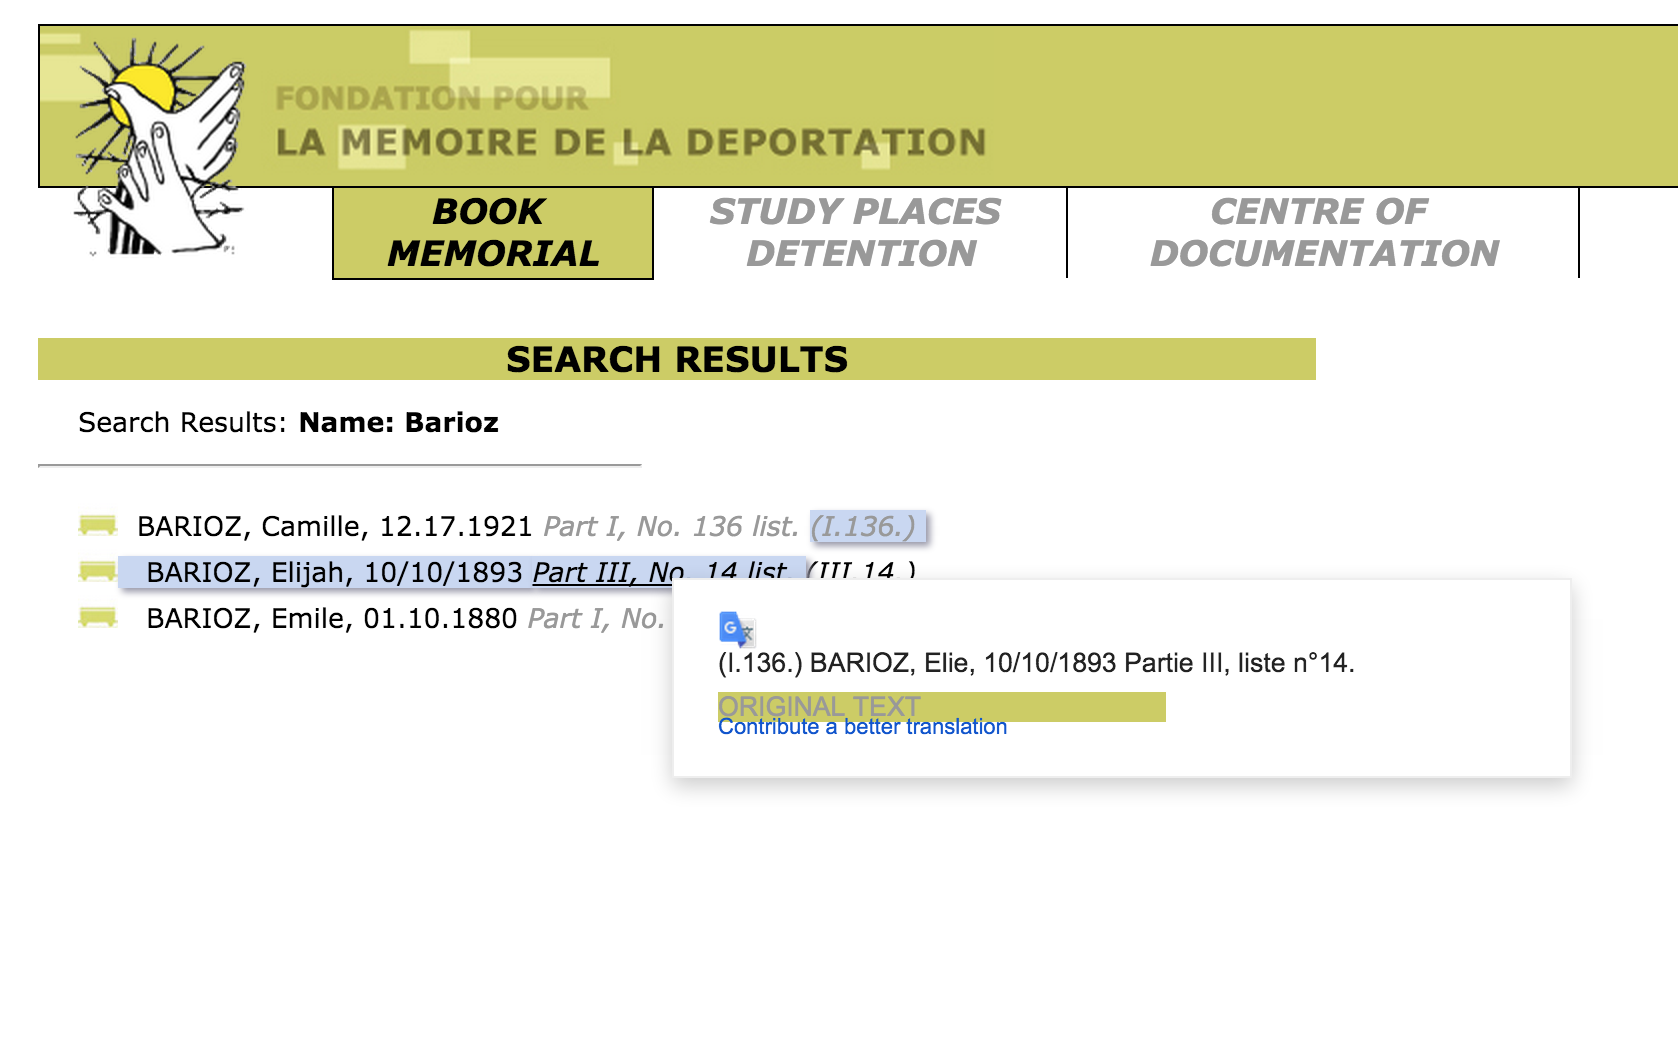
    • The correct individual can be determined by comparing the full name and the birthdate. The citation to the location in the book is a hyperlink to that record (ex. Part III, No. 14 list. (III.14.)).image-of-matches
    • The abbreviations for this individual’s interment locations are hyperlinks to more information, part of which is the full name of the location. Clicking on ‘Wil’ results in a pop up window describing the KZ at Wilhelmshaven and information about the city.
      image-location-pop-up
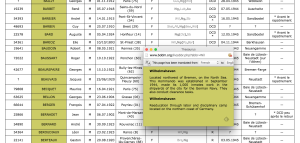
    • After determining that ‘Wil’ meant ‘Wilhelmshaven’, all occurrences of ‘Wil’ in that column can be changed to ‘Wilhelmshaven’.This process is repeated until all of the abbreviations have been translated.
  • Remove extraneous asterisks. It was quite frustrating to note that the French site did not include information on what the asterisk and other odd symbols mean. (Another odd notation is the numbers in parenthesis after the birth location.) I had to simply just delete the asterisks, losing any possible meaning they might have had.
  • Combine duplicates. Keep as much information from both records as possible.
  • Fix dates. They should all be the same format. This is tricky, in that Europe keeps dates in the format MM-DD-YYYY. For clarity sake, it would be best to use “Month DD, YYYY”. I left them as is for now. Editing 280 dates is not fun…
  • Fix nationality. The Tableau software references current nations. The data in the spread sheets uses nations current to the time of creation. For example, some individuals were noted with the nationality of ‘Soviet Union (Ukraine)’. These needed to be brought to the present as ‘Ukraine’. More problematic were the individuals from ‘Czechoslovakia’. Presently, there is the Czech Republic and Slovakia. The question is, which present day nationality to pick. There is a column for birth place which potentially solves the issue, but this field is for where the individual was born, wich, in the case of Jan Siminski, is seen. He was born in the Polish town of Obersitz (German translation), so the birth place can not clarify his nationality as Czech or Slovakian.
  • This brings up another issue, the translation of place names. City names in German, especially during the Third Reich, are different than current German names for the city, which are different than the English name of the city, which are different than what the nation calls the city. I need to standardize the names, picking, probably English. Tableau seemed to have no problem with the ethnic city names, or the German version, so I left them as is.
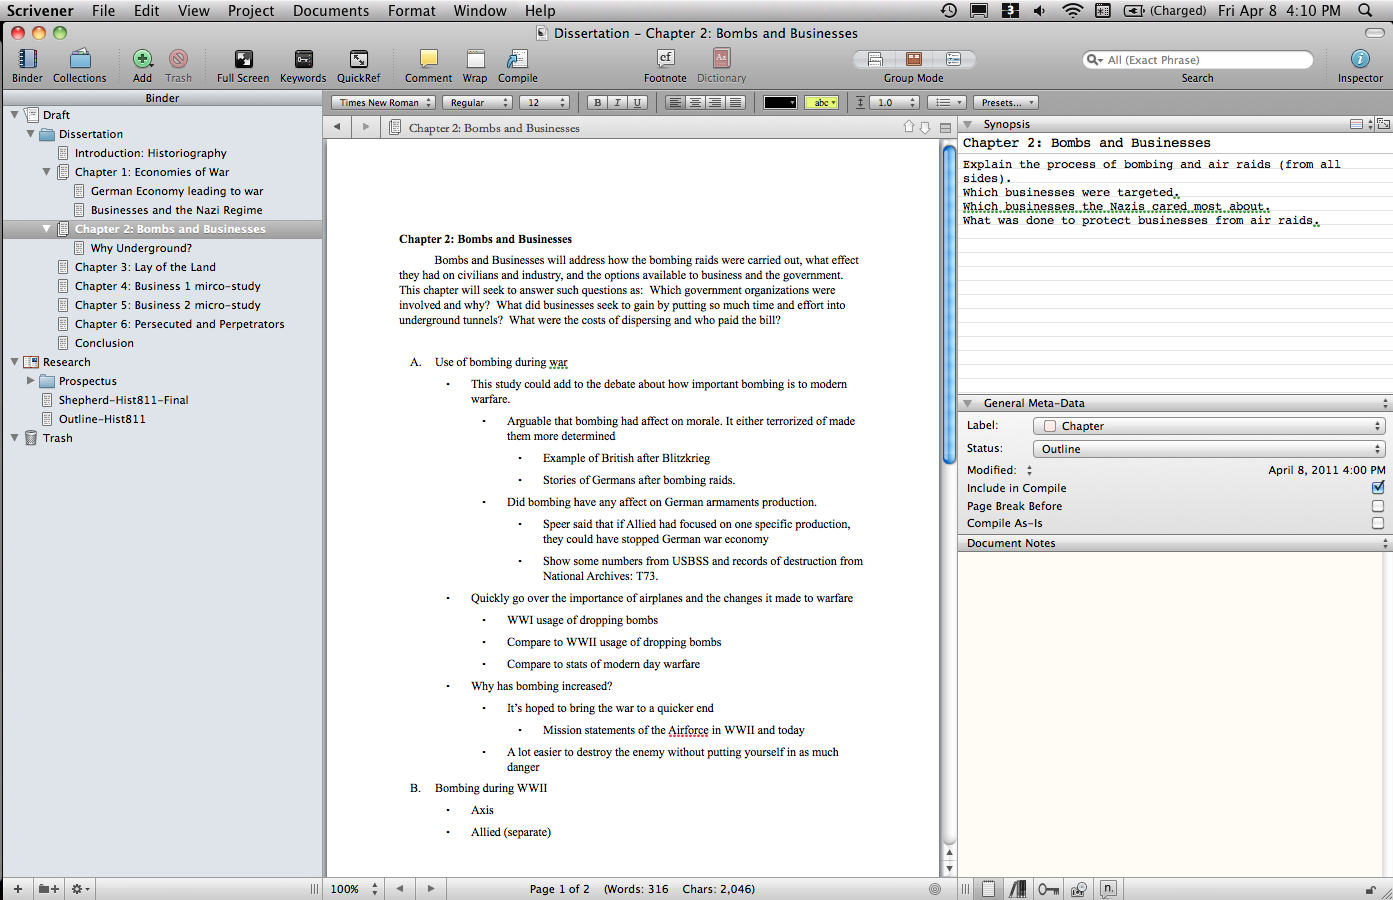
 

Tool Picking

I used the free program, Tableau Public: http://www.tableau.com/

This allows for very quick visuals, and a very easy process. The website has a number of free tutorials to get started. http://www.tableau.com/learn/training
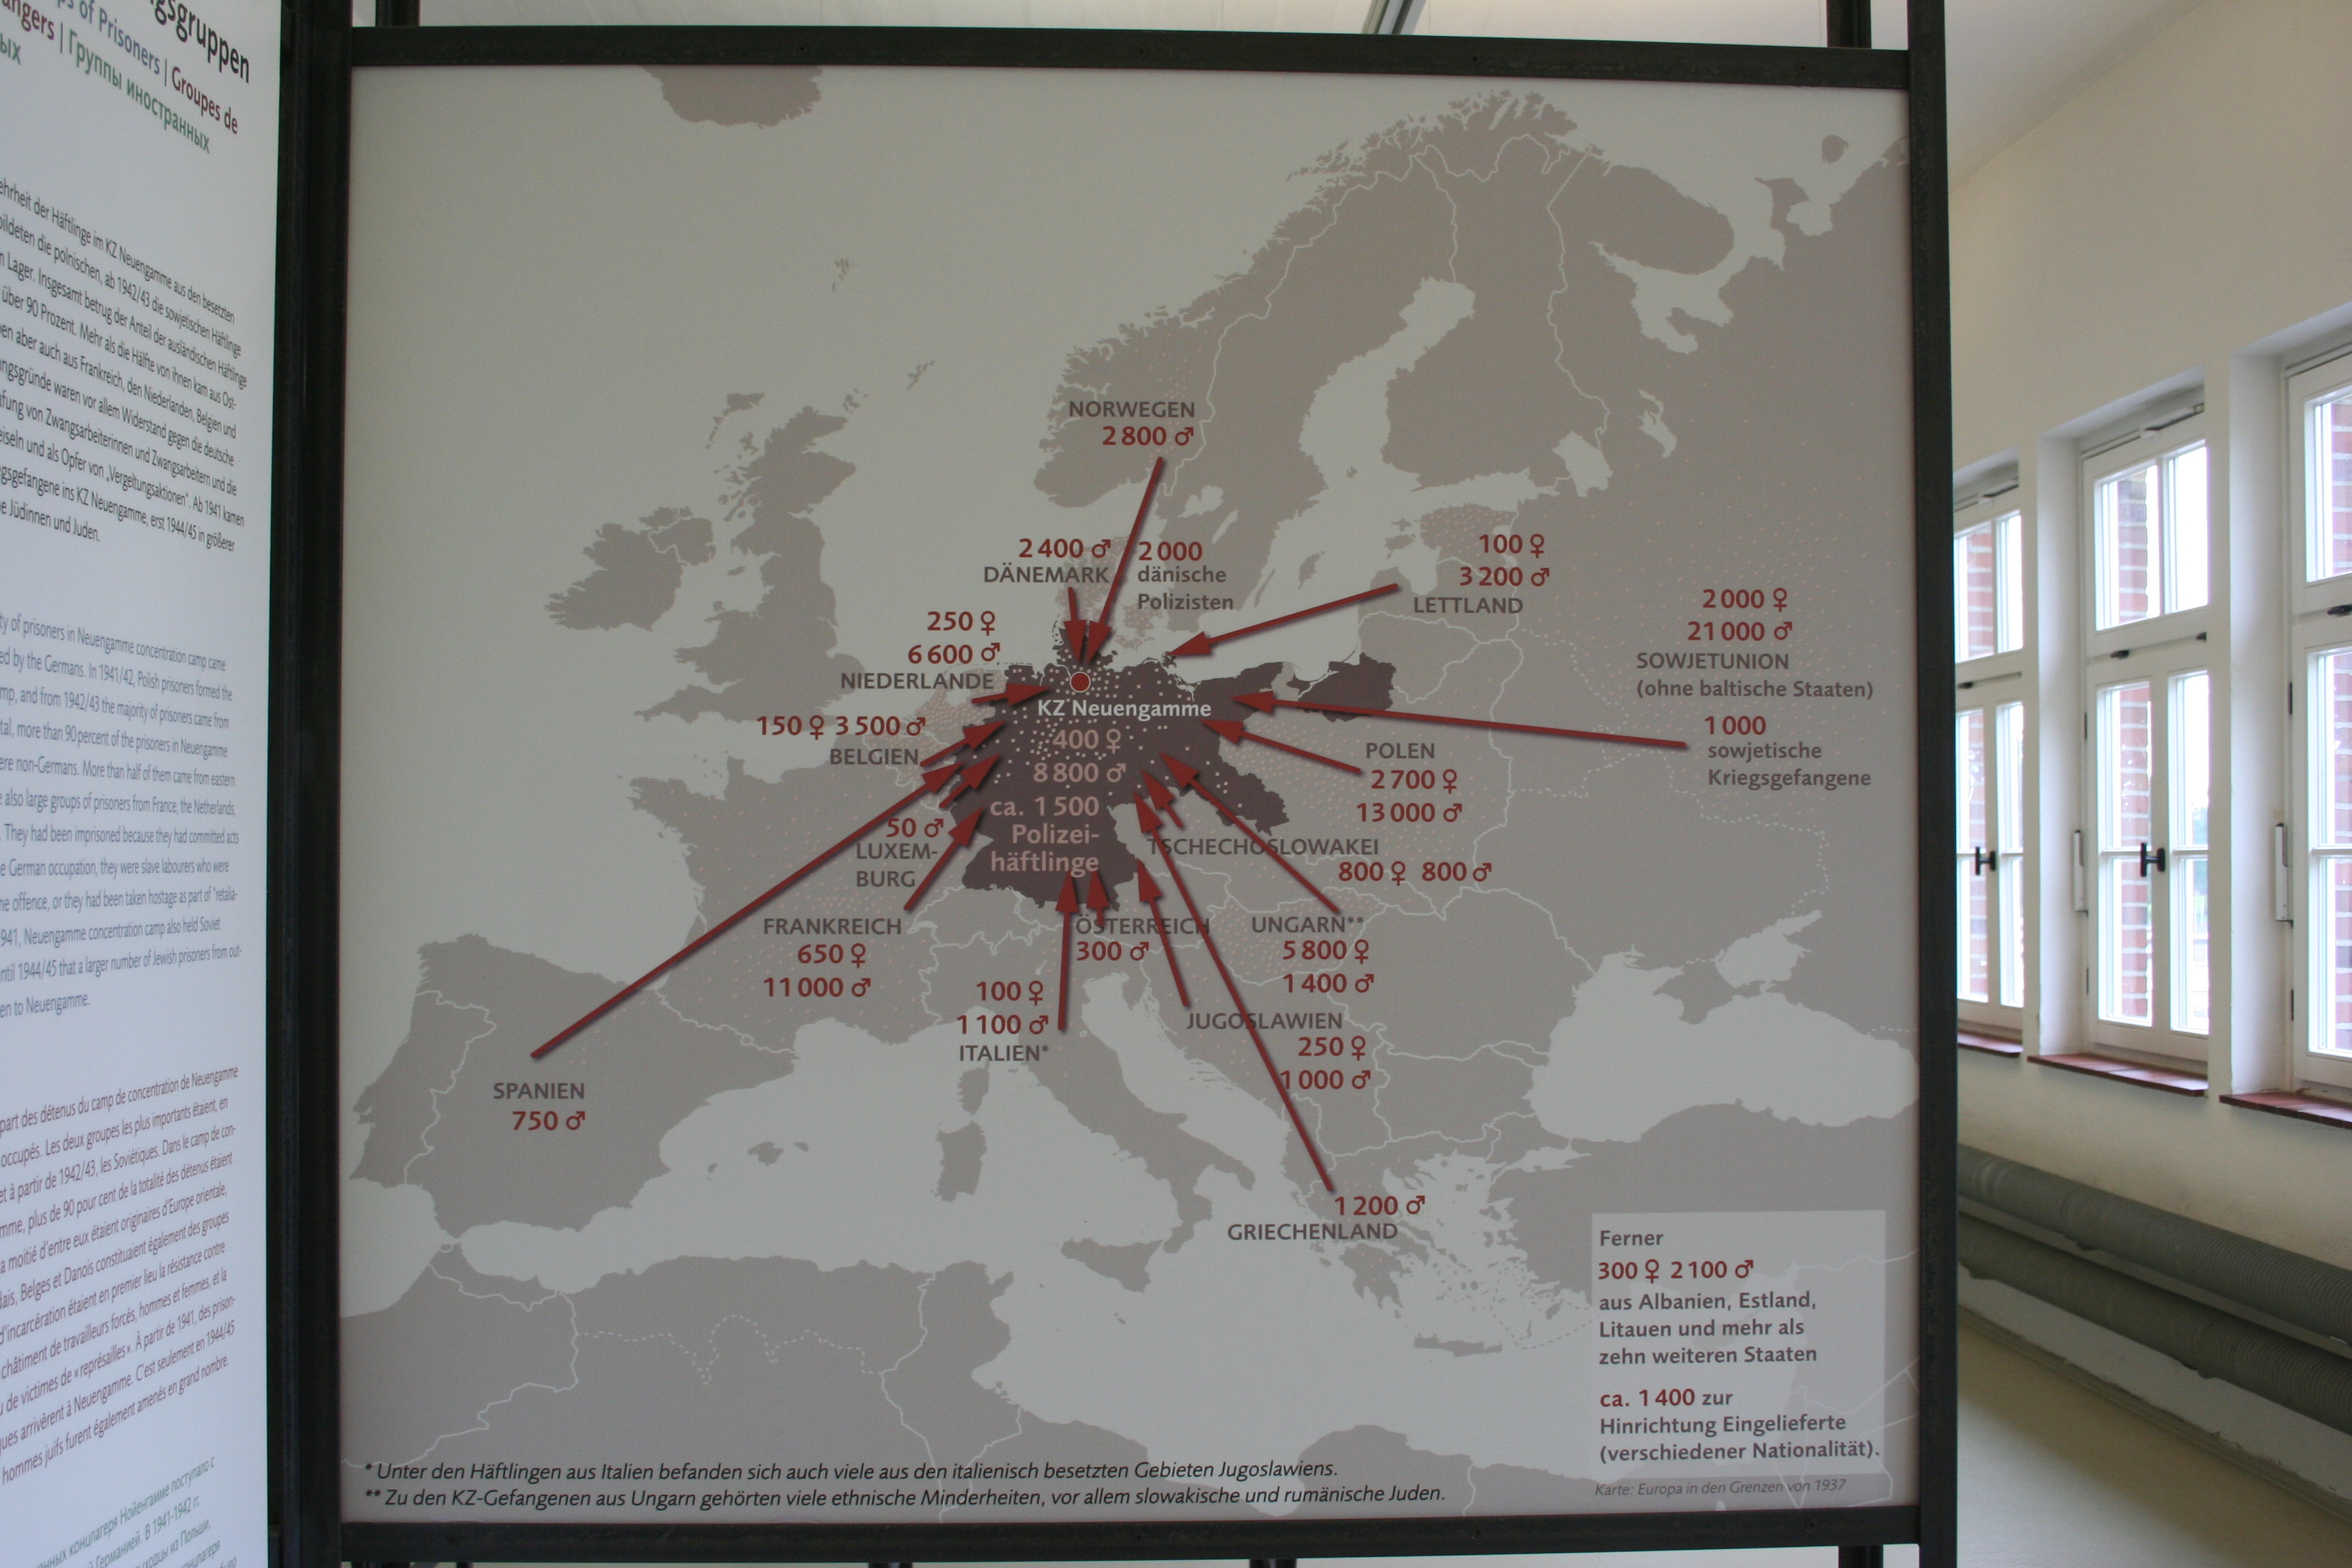
Map

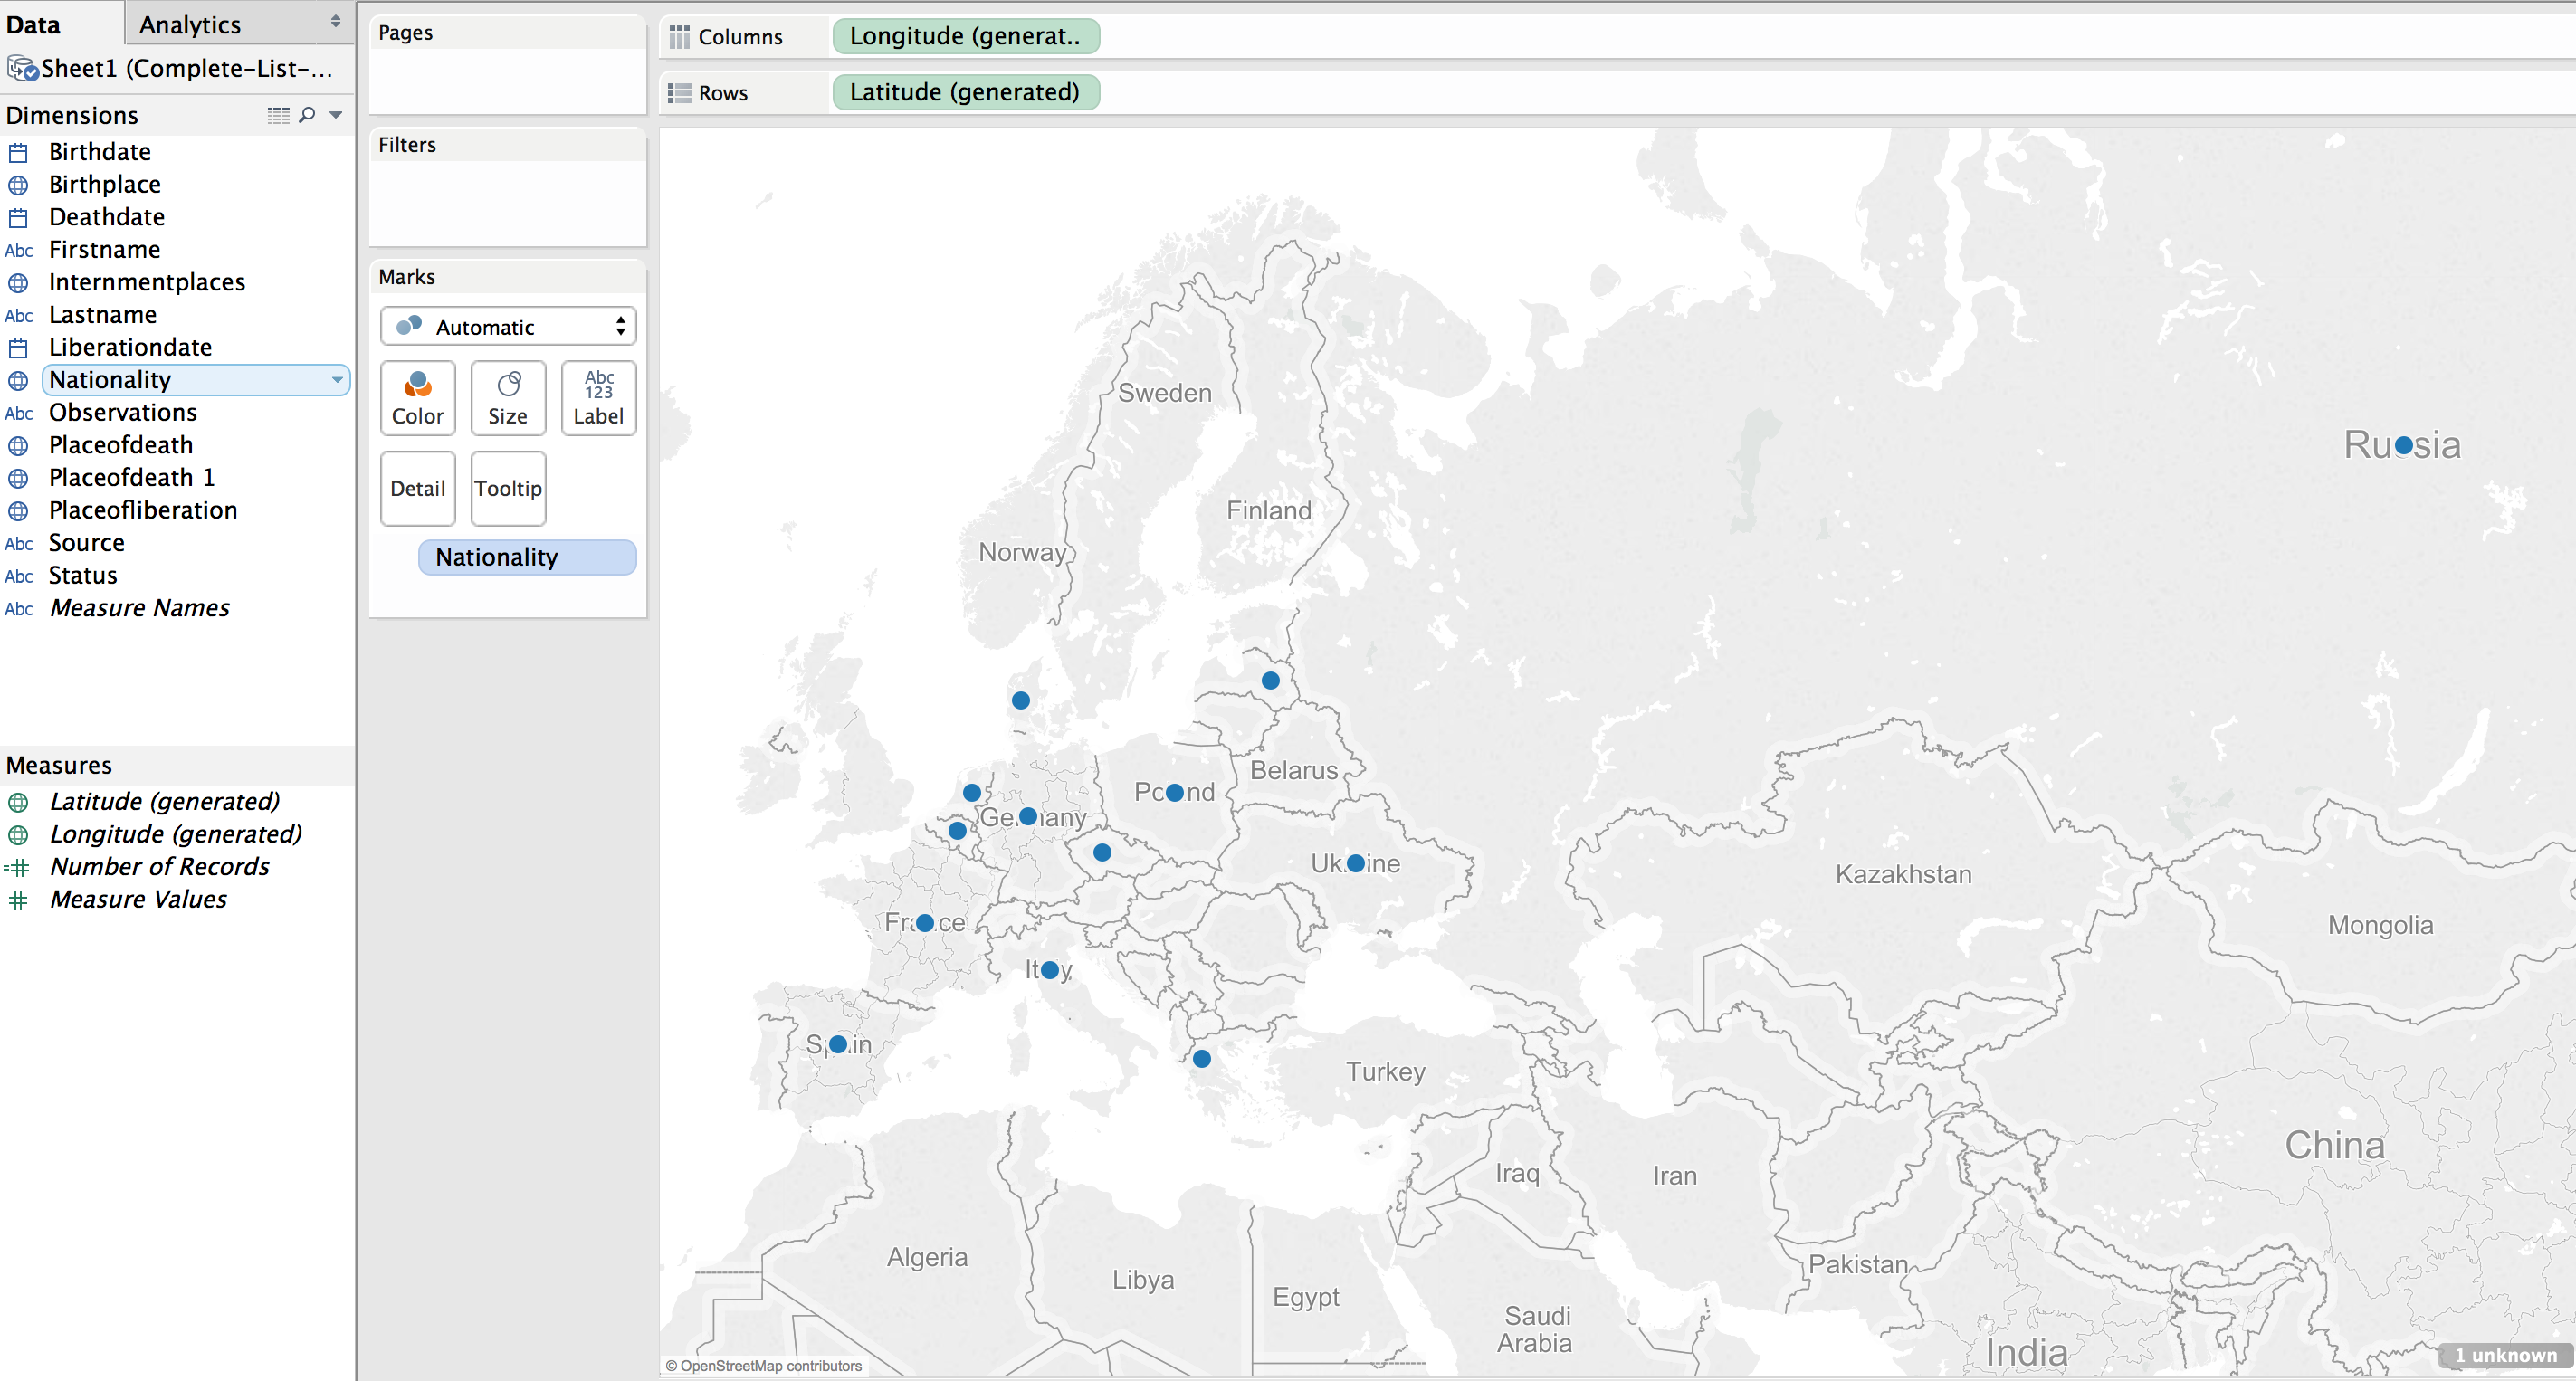
The first visualization I wanted to make was a map showing where the prisoners were from, their nationality. The map would also show the number of prisoners from each country. (This is not a tutorial on how to use Tableau, but a walk through of the pertinent choices I made to make sense of the data, it is methodology, not tech support. 🙂 )

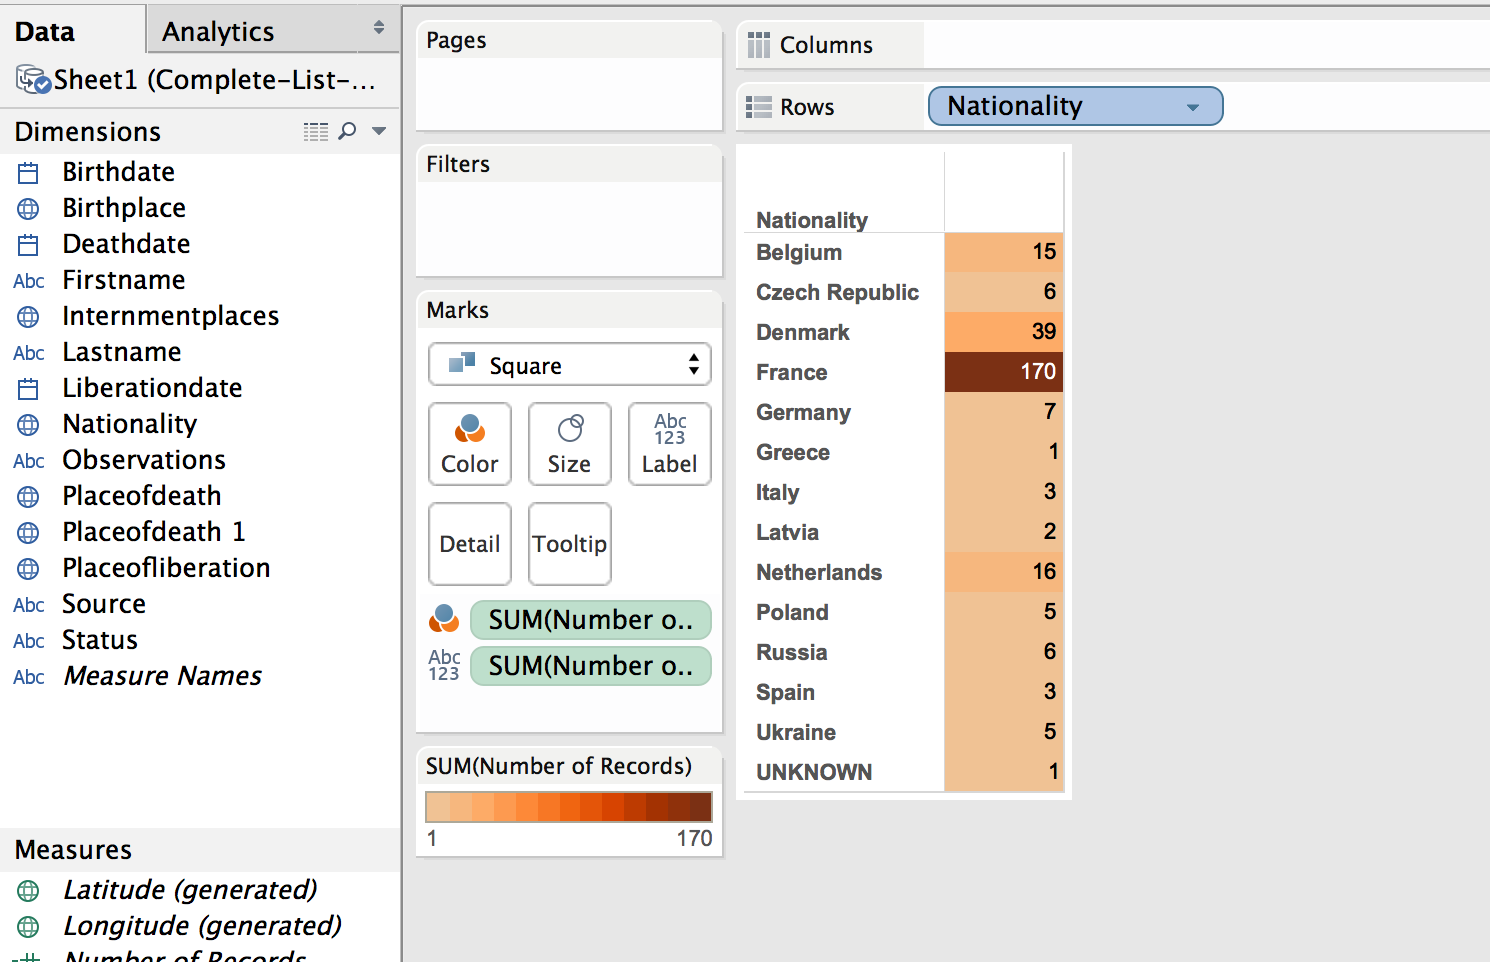
Using the default settings (basically, just double clicking on the Nationality field to create the map) results in a dot on each country represented in the data.

image-blue-dots-map
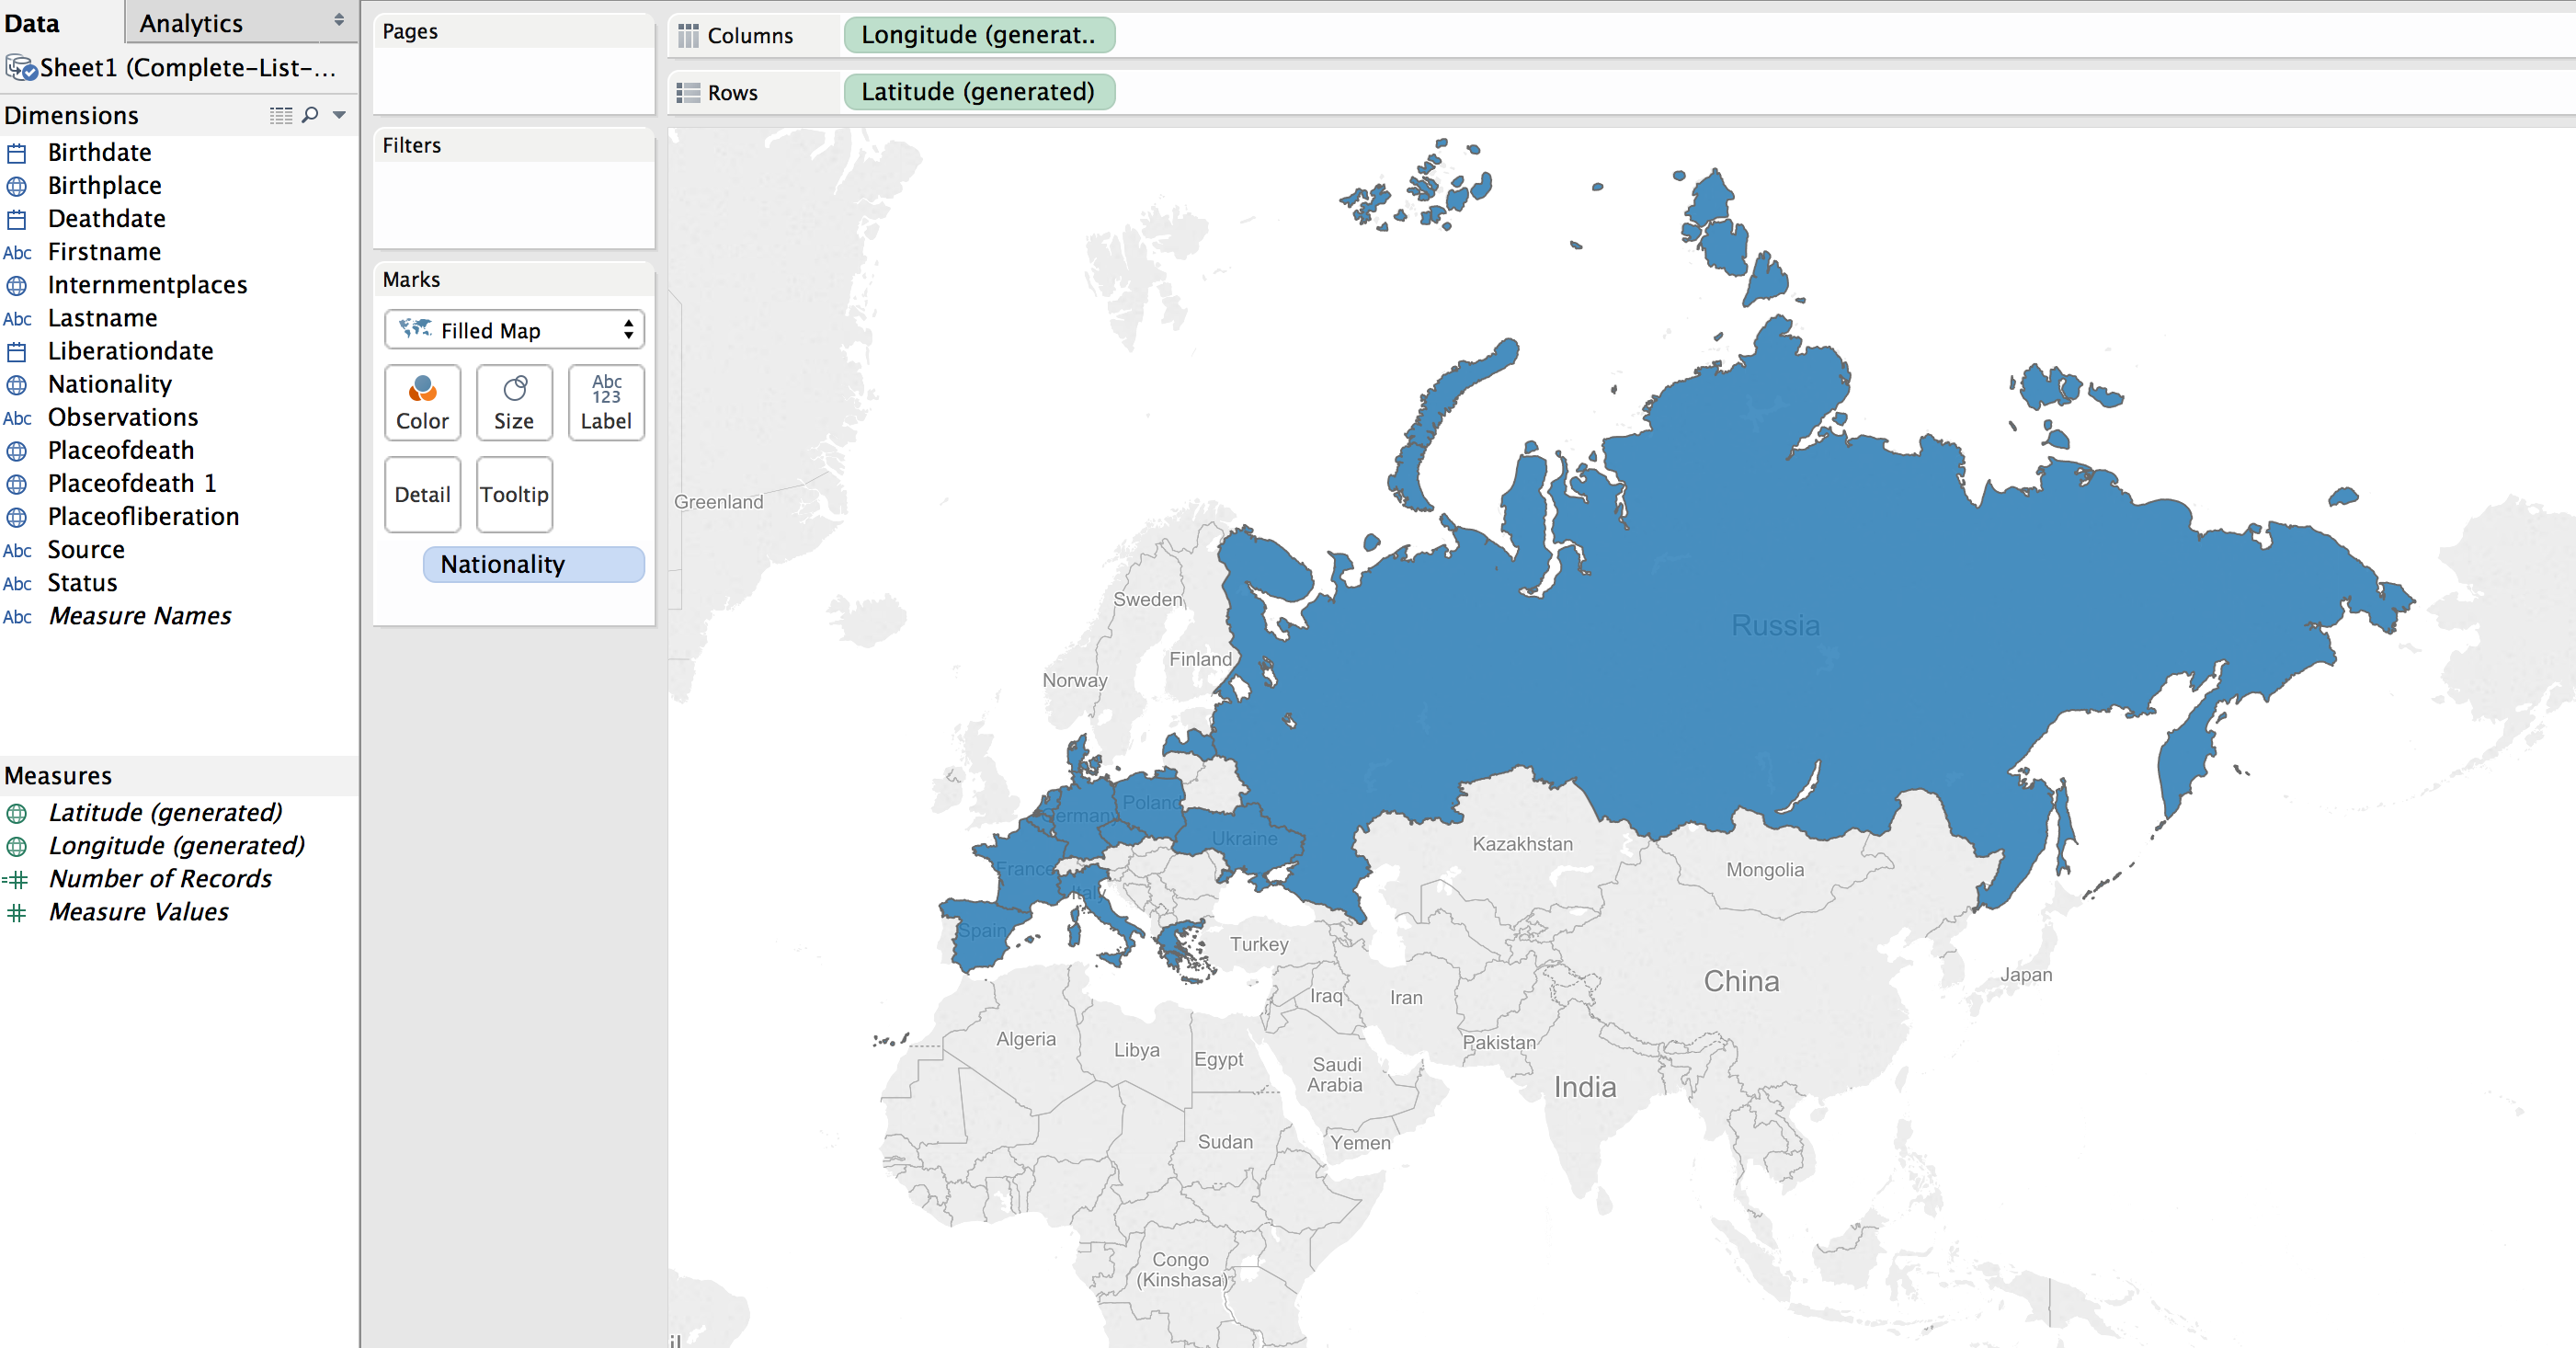
This can be transformed into a polygon highlight of the country by selecting a “Filled Map”.

image-filled-map
Next step was to apply shading to the filled map; the larger the number of prisoners who died from that country the darker the fill color.
image-filled-map
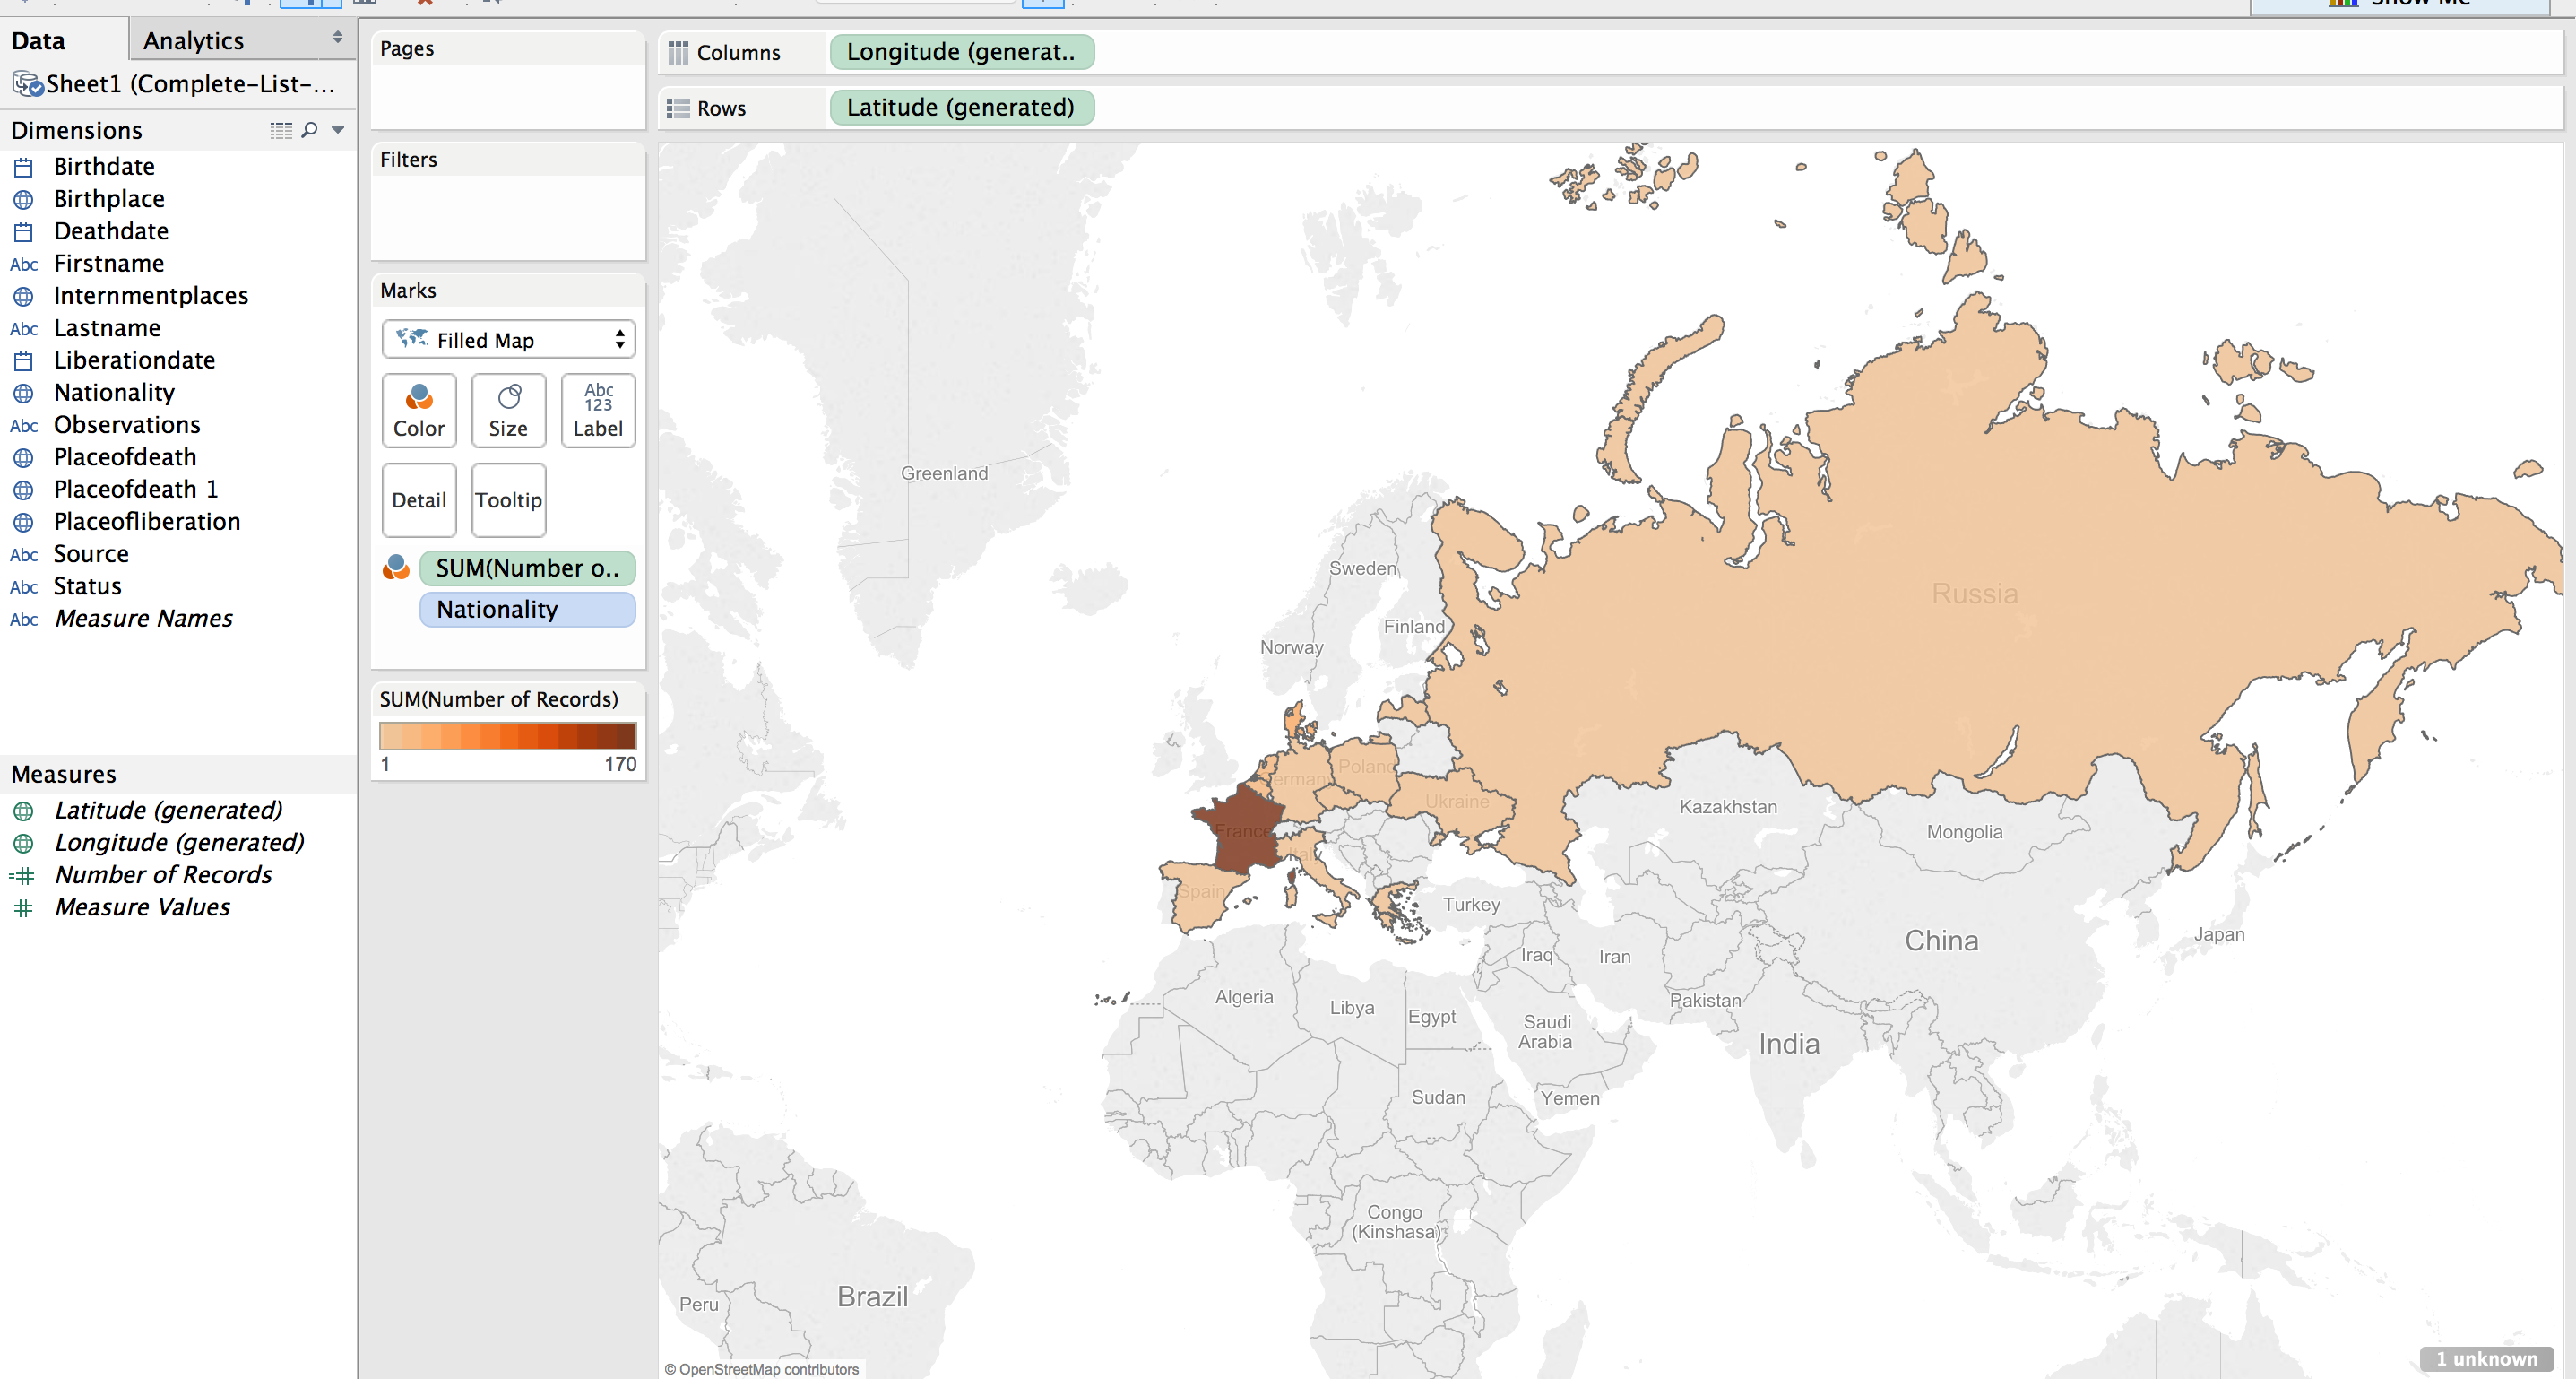
The default color was shades of green. I wanted a more dull color to fit in with the theme of the visualization, “death”. I picked a light orange to brown default gradient, separated into 13 steps (there are 13 countries represented).

Table

While just a filled map with gradient colored countries is helpful, the information would be more complete, more fully understandable, with a legend. This can be created by using a plane table listing the countries and the number of dead from that country. Each row is color coordinated with the map by using the same color scheme and number of steps as with the map.
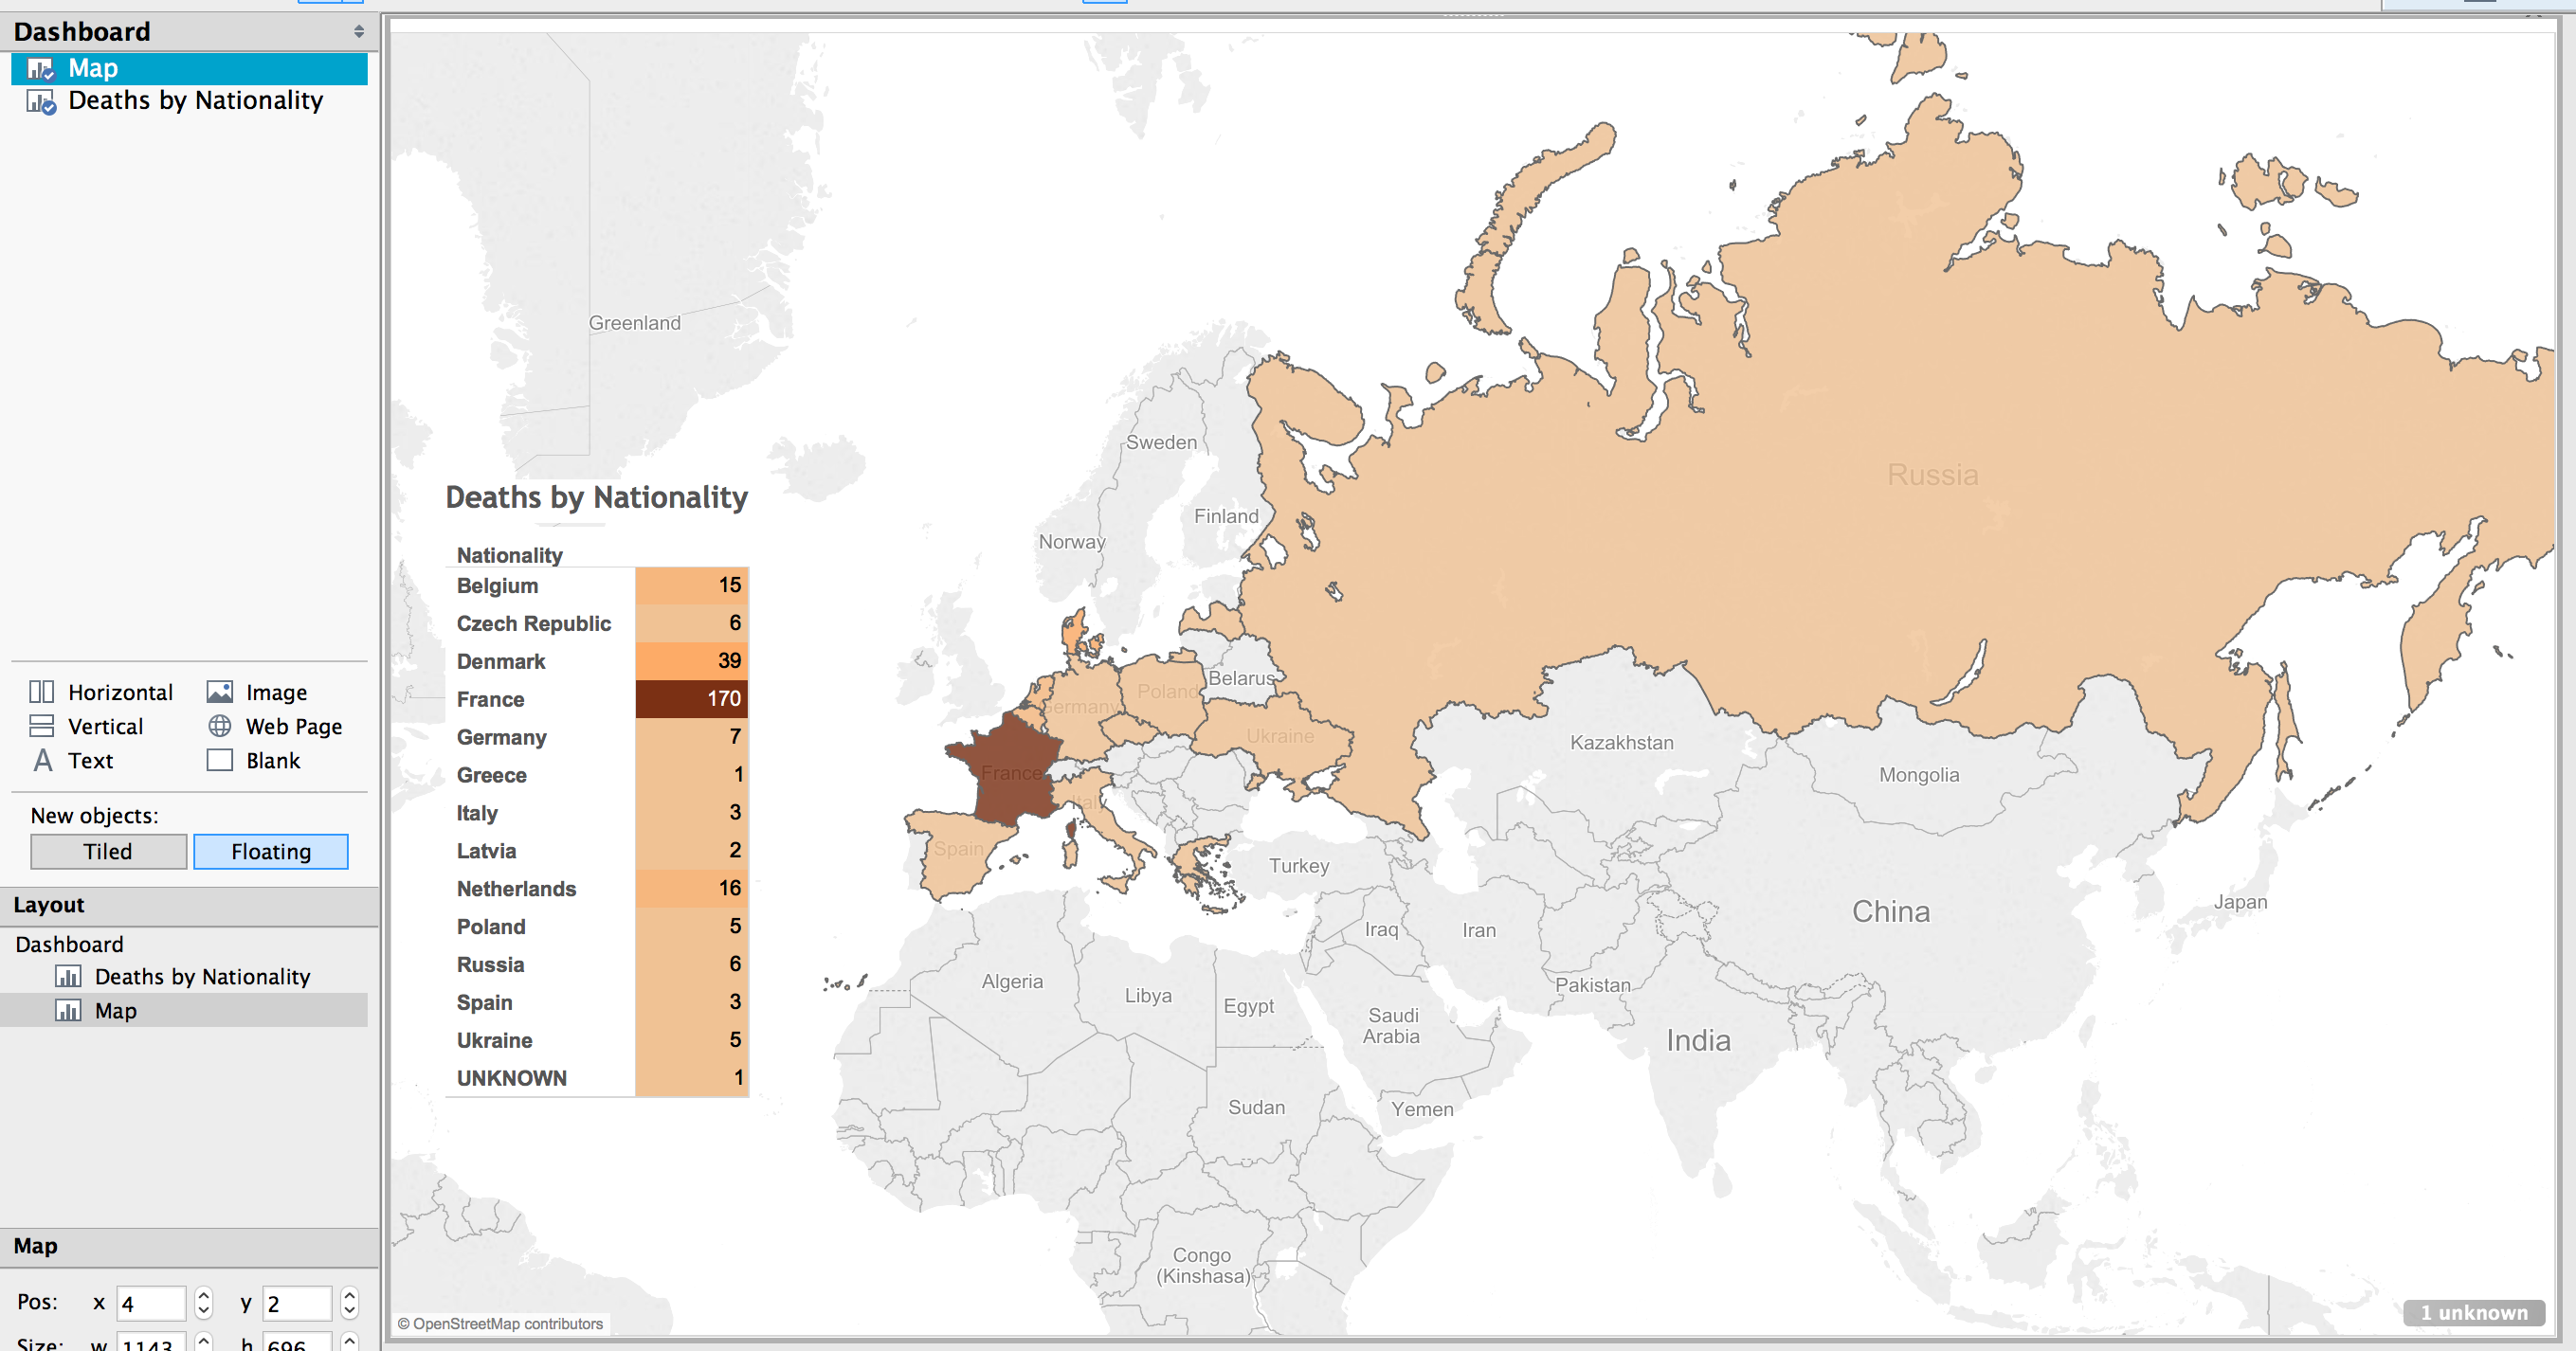
image-table


Dashboard

In Tableau, you create a dashboard to combine the different work sheets, maps, tables, graphs, etc. In this case, a full page map, with the table overlaid completes the visualization.

Result

The result is a very simple map, created in about ten minutes (after a few video tutorials to refresh my memory on how to create the affects I wanted).

(See a fully functioning result below this image.)
image-final-result


Benefits of Tableau

Tableau has some limitations. The results are hosted on their servers, which has the potential for lock down. They use proprietary, closed source code and applications.

But there are many benefits. The default visualizations look great. It is very easy to create simple and powerful visualizations. The product is capable of producing very sophisticated statistical representations. You can use the free and open source stats program R. The visualizations are embed-able in any website using Javascript.

The biggest benefit of using Tableau is the automatic link back to the original data source. I think the most needed shift in humanities (particularly the history profession), and the biggest benefit of “digital” capabilities for the humanities, is the ability to link to the source material. This makes it infinitely more easy for readers and other scholars to follow the source trail in order to provide better and more accurate feed back (read critique and support).

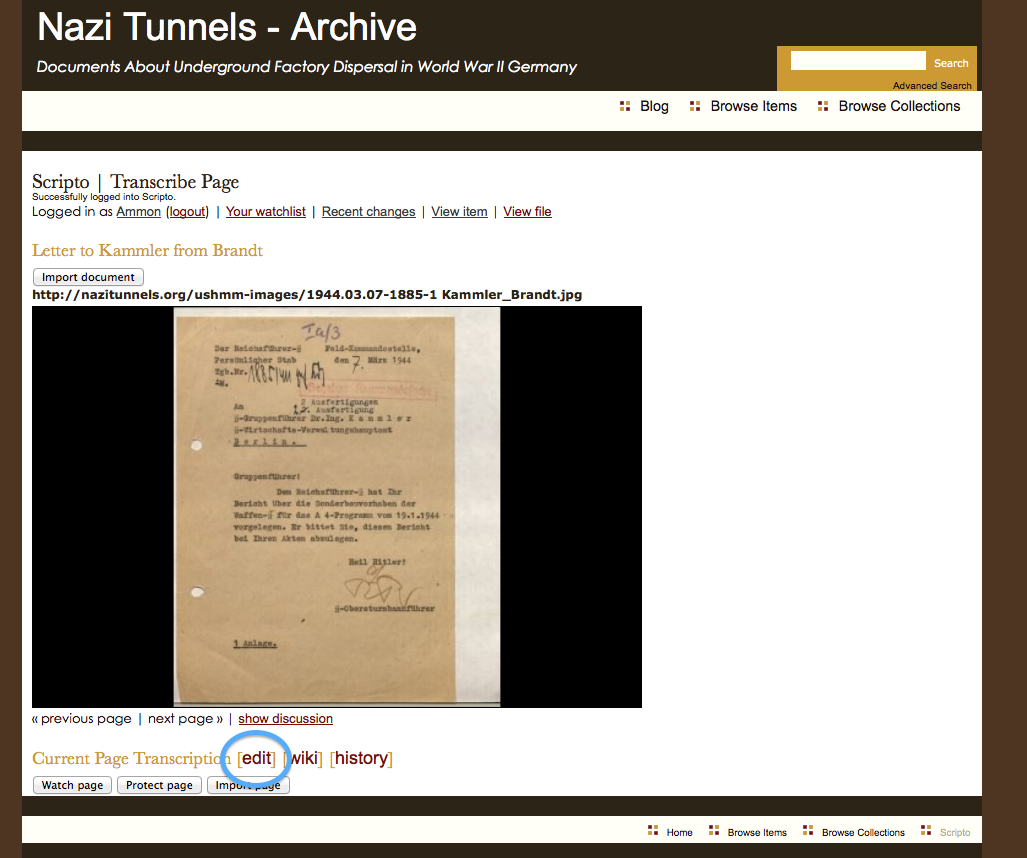
To see the underlying data in this visualization, click on a country in the map or the table. A pop up window appears with minimal data.

image-pop-up-info

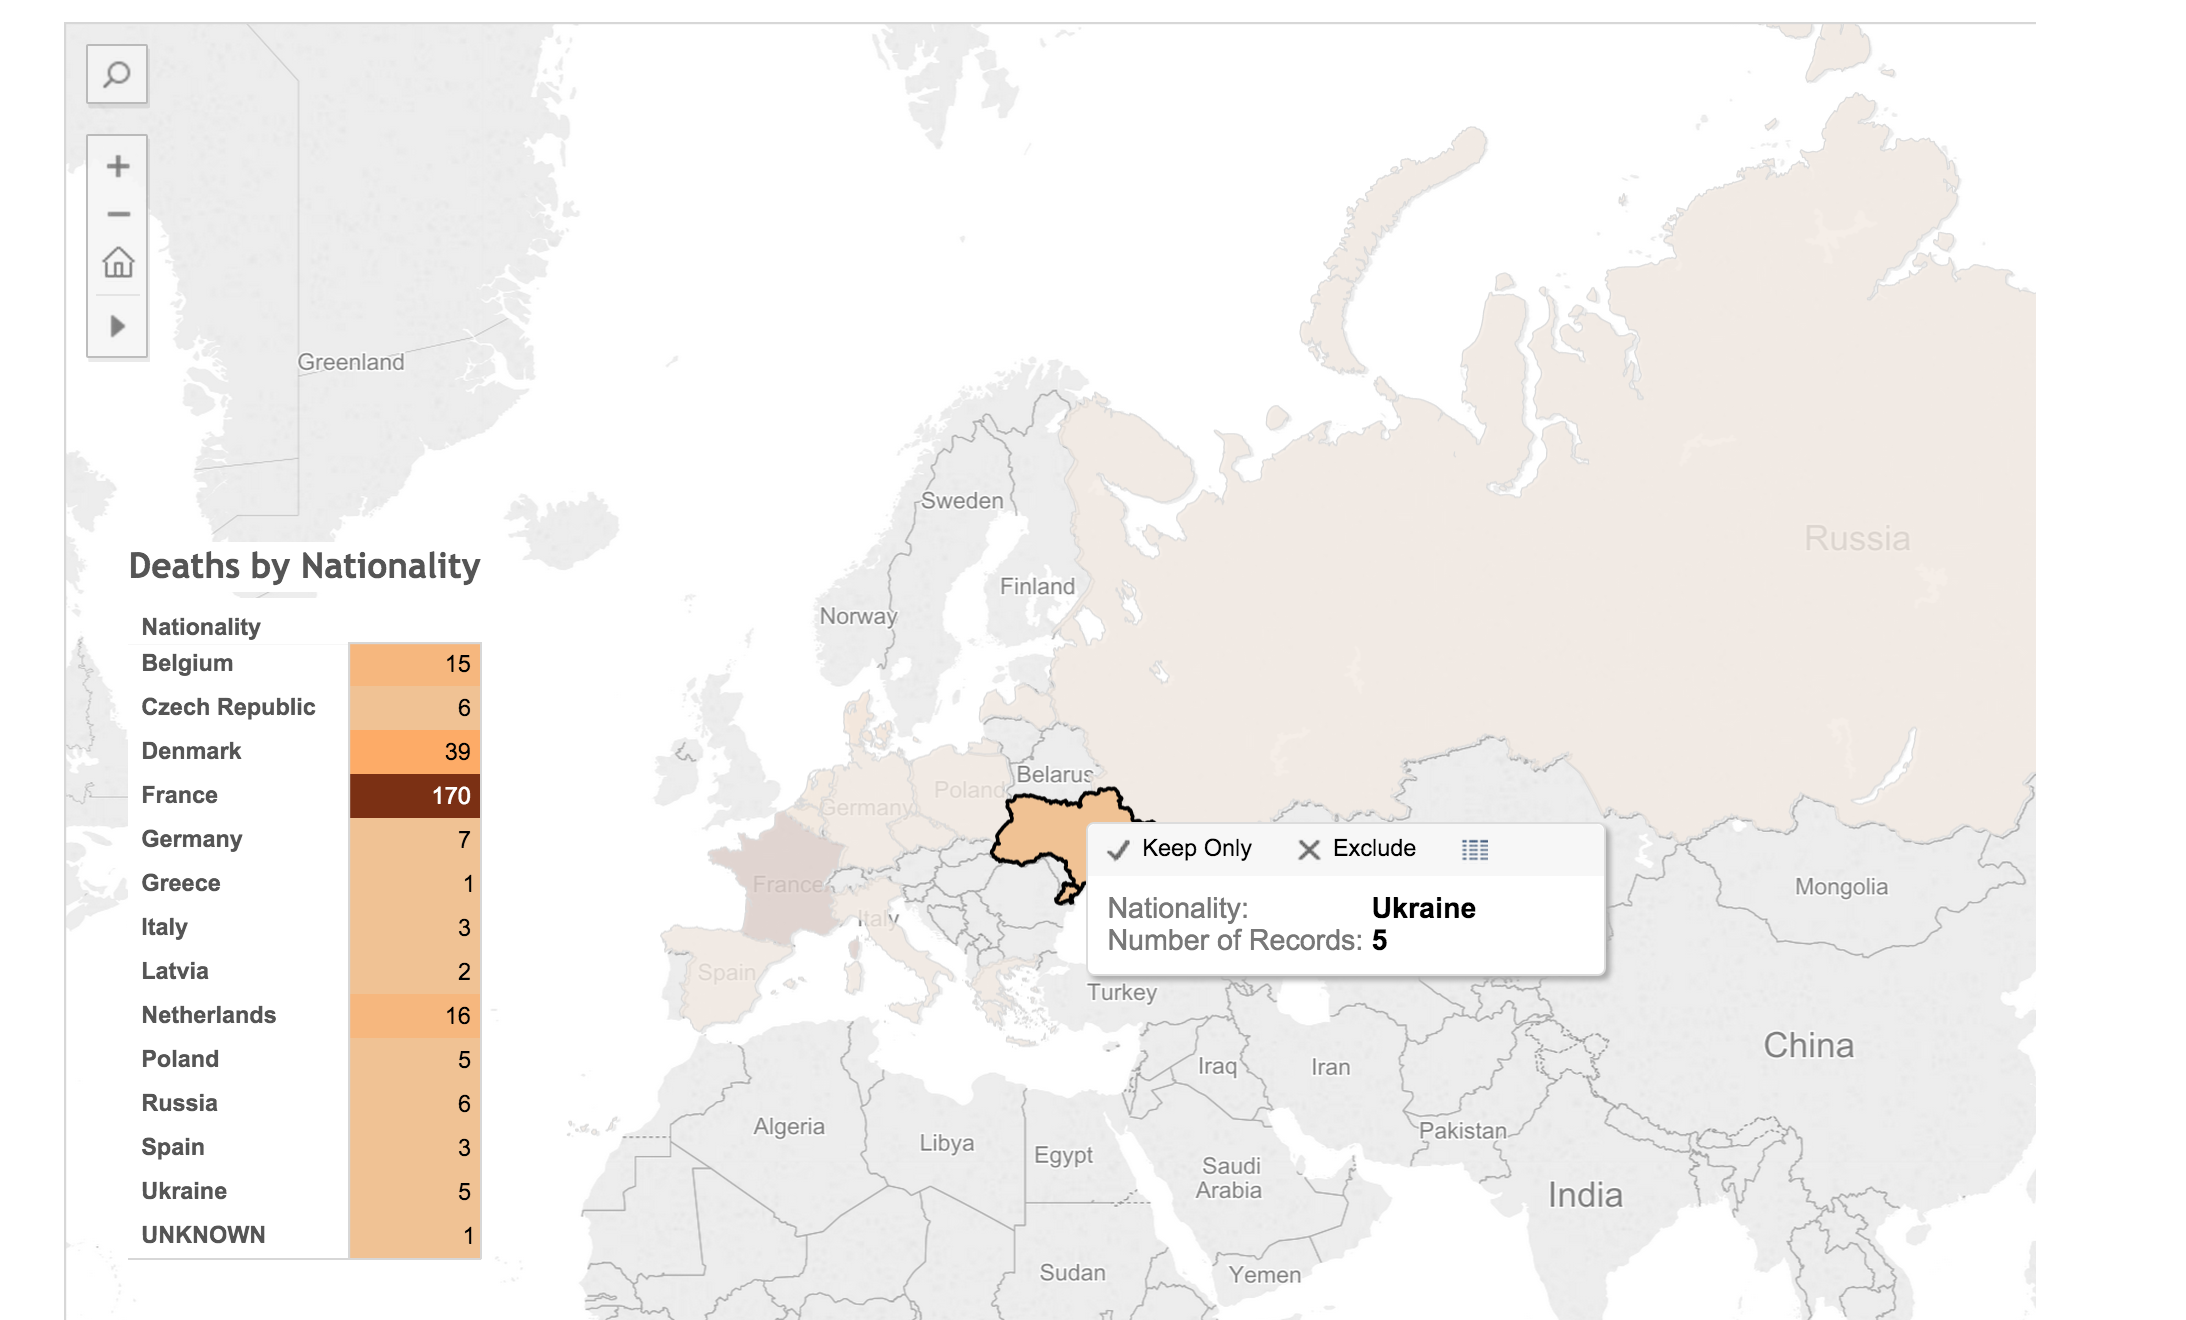
Click on the “View Data” icon.

image-view-data-icon

Select the “Underlying” tab and check the “Show all columns” box. Voilà!

image-underlying-data

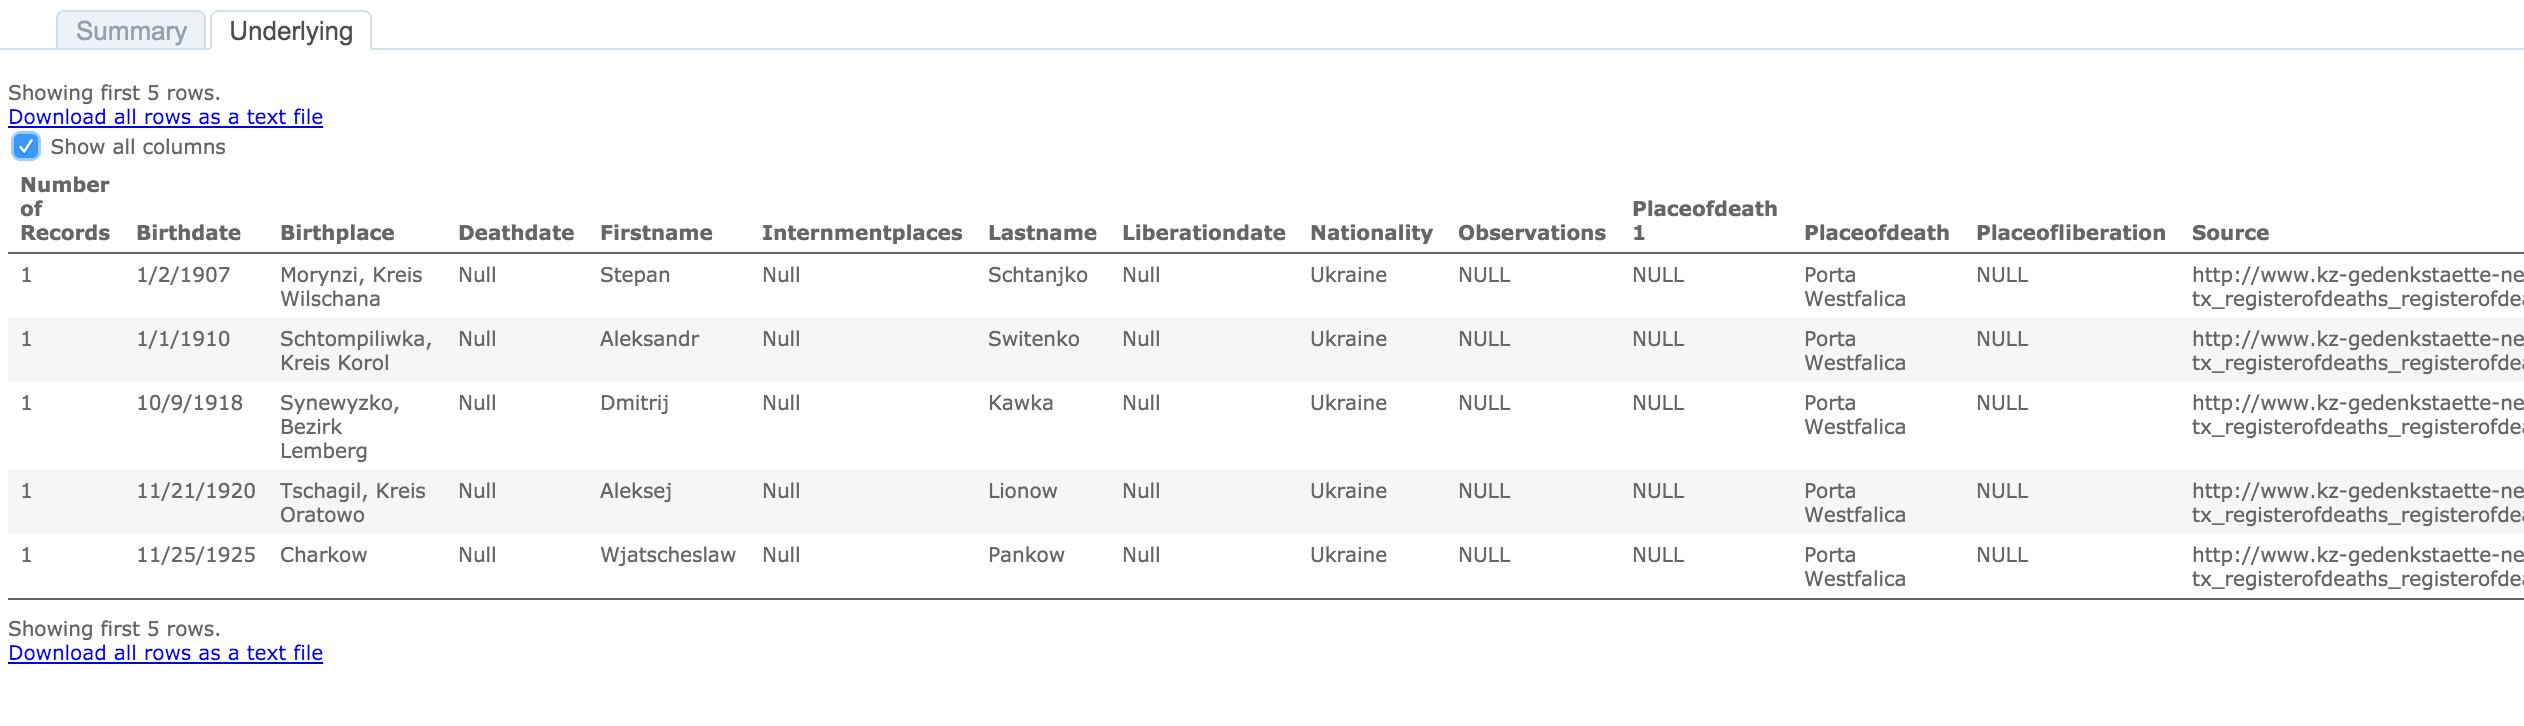
Behold the intoxicating power of being able to view the underlying data for a visualization!

Digital Humanities Improvement Idea

Imagine, if you will, the typical journal article or book, with footnotes or end notes referencing some primary document or page in another book or article. With digital media, that footnote turns into a hyper-link. A link to a digital copy of the primary document at the archive’s site, or the author’s own personal archive site. Or it links to a Google Book site with the page of the book or journal displayed. Now you have the whole document or at least a whole page of text to provide appropriate context to citation.

Way too often I have been met with a dead end in following citations; especially references to documents in an archive. Not often, but archives change catalog formats, documents move in an archive, they no longer are available to researchers, etc. It would be so much easier to have a link to what some researcher has already spent time finding. Let’s build on the shoulders of each other, rather than make each scholar waste time doing archival research that has already been done.

I think it incumbent upon all researchers to provide more than a dead-text citation to their sources. In this digital age, it is becoming more and more trivial to set up a repository of the sources used in research, and the skills needed to provide a link to an item in a repository less demanding. Here are some ideas on how to accomplish this already.

  • Set up a free, hosted version of Omeka at http://omeka.net. Add all of your source material to Omeka. Provide a link to the document in Omeka along with your citation in the footnote or end note.
  • Create a free WordPress account at http://wordpress.com. Add a post for each source document. Provide a link to that post in your citation.
  • Most universities have a free faculty or student web hosting environment (something likehttp://univ.edu/~usrname/). Dump all of your digital copies of your documents in that space (nicely organized in descriptive folders and with descriptive file names–no spaces in the names, of course). Now, provide a link to that resource in your citation.
  • Set up a free Zotero account at http://zotero.org. Set up a Group Library as Public and publish all of your sources to this library.

I intend to take my own advice. I have an Omeka repository already set up, with a few resources there already: NaziTunnels Document Repository. Once I start publishing the text of my dissertation, there will be links back to the primary document in the footnotes.

I would love to see this type of digital citation become as ubiquitous as the present-day dead-text citation.

I have not addressed Copyright issues with this. Copyright restrictions will severely limit the resources to be used in an online sources repository, but there are certainly work ways to work around this.

If hosting the sources on your own, one quick fix would be to put the digital citation sources behind a password (available in the book or journal text). Another option might be to get permission from the archive if only low quality reproductions are offered.

End

Let me know if you find the live-text or digital citation idea viable. Do you have other ideas for providing a repository of your sources?

Drop me a note if you want more detail on how I created the map in Tableau. I’m by no means proficient or in no way the technical support for Tableau, but I’ll do what I can to guide and advise.

Irony Juxtaposed

Here’s an interesting history I ran across in my research. It’s a little bit of situational irony, something that happens to everyone. This woman was able to notice it and find humor in it later in life despite all of the tragedy. This event is juxtaposed with another event that shows how interesting humanity can be. Even though she had just survived months of the most brutal displays of humanity in the concentration camps, she was able to show compassion to her “enemy”.

Györgyné (Zsuzsa) Papp was born in Budapest, Hungary in 1921. Her family was Jewish, but not religiously. She was arrested and sent to Auschwitz. Later she was selected to go to a labor camp. She ended up being transferred to several labor camps and ended up in Salzwedel.

One morning she woke up and all of her captors were gone. It was April 1945. The Americans were advancing quickly, so the German soldiers had fled. Zsuzsa and her sister went into the town of Salzwedel to search for food. The town was nearly deserted as well. They went into stores already looted by other prisoners. Then entered homes to find any food they could. In one home they found a loaf of bread on the table. As they went to get it they heard sobs from a woman who told them that was all the food she had left for herself and her four children. Even though they were starving and had been abused and mistreated for months by this woman’s nation, they felt pity on her and left the bread.

Zsuzsa tells how one of the things she was most fearful of while in the concentration camps was cleaning the latrines. They were just too awful for her to contemplate. She felt so fortunate to have escaped the dreaded latrine duty in all her months in the concentration camps. As she was walking around Salzwedel she somehow fell into a ditch used for a latrine and found herself covered in waste.

Neuengamme: Second Week Part 2

South of Hamburg, and just south of the town of Bergedorf, lies the rural area known as Neuengamme. During World War II this area was turned into a large concentration camp, housing mainly political and war prisoners from surrounding countries. During the last few years of the war, many of these prisoners were taken to “satellite” camps for use in SS building projects. One of these projects was to become the underground factories in Porta Westfalica. Some 2000 men and women were transported from Neungamme to Porta Westfalica to convert the mines and create new tunnels into underground factory space. After the war, the Neungamme concentration camp was used as a prison, and only recently turned into a museum and archive commemorating the victims of Nazi terror.

The staff at the archive, particularly, Mrs. Alyn Beßmann, helped me find all of their resources regarding the sub-camps at Porta Westfalica. Of particular interest from the Neuengamme archive were the many interviews conducted by former concentration camp inmates. I was able to make copies of the interviews of twenty-four inmates who were moved from the larger camp at Neuengamme to one of the smaller camps at Porta Westfalica. Particularly helpful at Neuengamme was the exhibits about the life of inmates at the Neuengamme concentration camp, and the extent of the concentration camps in Germany’s occupied territories. Particularly striking, is a large map with small markers indicating the location of all known large main camps and sub-camps. Fourteen large camps provided inmates to hundreds of smaller sub-camps throughout Germany, France, Holland, Austria, Czech Republic, and Poland. The extent of the terror brought about by the Nazi ideology is truly astounding.

Staatsarchiv Detmold: First week in Germany

Well, here I am. In Germany again. The overriding thought for this trip is not the awesome opportunity to be in Europe, to see wonderful cities, meet amazingly friendly people, or finally be able to get into the “meat and potatoes” of this darn dissertation. No, I’m much more practical than that. My overriding thought, is… I sure miss my family. How can I be away for a whole month? My baby girl won’t even remember me, will she? Think about that next time you think going off to Europe to do research sounds so cool.

Hotel Nadler, home for a few days.

That’s the reality of the situation. Now on to the academic and other sides of things. The first stop on my research trip is Detmold. It is a very pretty city, so I’ll intersperse this post with pictures. Here I will be looking for anything in any way related to the tunnels at Porta Westfalica. I’m staying at the Hotel Nadler, a quaint little Fachwerkhaus turned into a restaurant and hotel. It’s right on the outskirts of the city center, where all the action is. I picked this location for it’s closeness to the city center and because it’s not too far from the archive. Just a 10-15 minute walk. I have done that for all of the locations except Berlin. That makes me walk so I get some exercise before and after sitting at a desk looking at old papers all day.

I got to the city too late to get to the archives the first day, so I went the second day I was there. And the two following days there after. That was Wednesday, Thursday and Friday. The first day made the trip seem a bit worthless. Of the fifteen or so folders of material that I had to go through, I got through about seven of them on Wednesday, and there was nothing worth wile in them, at least not for me. I did almost want to change my topic to something about how to prepare your house or building for bombing raids. There were some cool brochures and books on that. I later saw a portion of a documentary on TV that showed some training videos on what to when bombed by the British fire bombs. That seems like it could be a good research project; focusing on the literature and other forms of educating the populace on how to survive bombing raids. Anyhow, I digress.

This building is a bit off-kilter

On Thursday and Friday I hit the proverbial jackpot. Not for documents relating to the building and use of the tunnels during the war, but what was done with it afterwards. Most of the works out there all close their research with liberation by the US or British. I want to write about what happened after that. How did the people in the area deal with all of those former prisoners? Where did the former prisoners go? What did they do with these huge holes in their mountains? What happened with the equipment? Who was punished?

What I found in the archive were loads of documents that dealt with this post-war period. Unfortunately the archive follows the arcane tradition of not allowing users to maker their own copies of their documents. If I had a whole month, or $1000, I could have got all of the information. But I will have to be satisfied with what I could transcribe into my computer. One folder was full of tabulations of the weekly hours worked in the tunnel site in dismantling hardware and machinery, and preparing the site for demolition. Another folder was full of correspondence to those in charge of the post-war tunnel and the companies and firms that had contracts for building during the war. They apparently felt they should still be paid for work done. That’s something I had never considered before. Companies that contracted with the National Socialist Government to build and design, were promised money. When the war was lost, the National Socialist Government dissolved. Well, did that dissolve the contracts as well? Were the companies to lose out on the money owed them? I’m not sure what the answer on that one is. But I found a bunch of complaints and claims from building companies and architecture firms that wanted payment from somebody.

Detmold Church
Detmold Church

One final thing that I found in Detmold, was the correspondence between the town of Hausberge and the occupying British Army. The British plan was to blow up the whole of the tunnel system due to the possibility of the location being a highly usable military compound. The Allied Occupying forces want to completely wipe out any German military compounds.

My time in Detmold was a bit too short, but I may be able to swing a day on the way back if all goes quickly in Berlin. But I doubt I’ll ever be back, unless some other generous organization would like to pay for another research trip.

Transcribing and Translating Documents in the Archive

Part of my dissertation methodology is to try to use collaboration to provide an increase in usable sources. To accomplish this, I have set up the Omeka archive with the wonderful Scripto tool. This tool marries an Omeka install with a MediaWiki install to provide a nice way to be able to view images in the archive in order to transcribe and translate them. This post shows the process for transcribing a document/image.


First, go to the archive page: http://nazitunnels.org/archive/

First, go to the archive home page: http://nazitunnels.org/archive/

Next, you’ll want to search for a particular file, or browse by item or collection. The search function is a bit limited at the time. It only searches for text in the titles, tags, and existing descriptions. It doesn’t search for already transcribed text.

Search for an item, or browse by item or category.

Once you find an item to transcribe, click on the image or title to go to that item’s page. On that page, near the bottom, you will see a link to transcribe the item. Go ahead and click on that.

Click the link to transcribe.

Now you are on the transcription page. Next you will need to log in. (If you would like to help transcribe and/or translate, send me an email, or comment on this post, and I can set you up with an account. And thank you in advance!)

Log in.
Log in.

login-screen

Once logged in, the page will be a little bit different.

Find the ‘edit’ link to start transcribing the image.

transcribe-page-loggedin

Notice the tools available for the image. (Move the mouse cursor over the image if you do not see them at first.)

Blue: You can zoom in and move the image around to get a better view of the text.

Red: Enter the transcribed text in the box. When done, click the ‘Edit transcription’ button.

Green: Only transcribed text should go in the transcription box, use the discussion page to enter comments about the item and ask questions.

Yellow: When you are done transcribing, and  have clicked the ‘Edit transcription’ button, you can log out.

Transcription Tools

Transcription Tools

There is more to transcribing that just typing out what you see. Sometimes it is hard to even know what you are looking at. Here are some guidelines and policies for transcribing the documents here.

Policy (taken from the US National Archives and Records Administration website)

  • NaziTunnels.org reserve the right to remove content or comments that contain abusive, vulgar, offensive, threatening or harassing language; personal attacks of any kind; or offensive terms that target specific individuals or groups.
  • NaziTunnels.org will remove content or comments that are clearly off-topic, that promote services or products, or that promote or oppose any political party, person campaigning for elected office, or any ballot proposition.
  • The content of all transcriptions and comments are visible to the public, thus submissions should not contain anything you do not wish to broadcast to the general public.
  • If you provide personally identifiable information such as social security numbers, addresses, and telephone numbers in the comments, it will be removed by the moderator. However, if a document itself contains archival or historical personally identifiable information, please transcribe it.
  • NaziTunnels.org do not discriminate against any views, but reserves the right not to post content or comments that do not adhere to these standards.
  • By contributing to the NaziTunnels.org you accept that other users may edit, alter, or remove your contribution.
  • By transcribing or translating a document, you agree that you will not assert or retain any intellectual property rights, including copyright in the translation or transcription.
  • If you think any of the information in the NaziTunnels.org Archive is subject to a valid copyright claim, please contact me using the Q & A page.
  • When transcribing records, you should make a good faith effort to accurately represent the information contained in the record. If a document or record is not legible in some parts, please indicate with “[illegible].” Please consult the Transcription Tips at NARA for more information.

Below is a handy list of links to help with transcribing German handwriting and transcribing in general

NARA FAQ: http://transcribe.archives.gov/faq

NARA Tips for Transcribing: http://transcribe.archives.gov/tips

Tips for reading old handwriting: http://www.genealogy.com/76_reading.html

German Script Tutorial from BYU: http://script.byu.edu/german/en/welcome.aspx

Three part lesson on reading German handwritten records, from Familysearch.org:

  1. https://www.familysearch.org/learningcenter/lesson/reading-german-handwritten-records-lesson-1-kurrent-letters/69
  2. https://www.familysearch.org/learningcenter/lesson/reading-german-handwritten-records-lesson-2-making-words-in-kurrent/70
  3. https://www.familysearch.org/learningcenter/lesson/reading-german-handwritten-records-lesson-3-reading-kurrent-documents/71

Reading Blackletters (Gothic German), just for fun, or in case:

The archive is live

Part of my dissertation is to create an online archive of the documents I find. Thanks to the Hist 698 Digital History Techne class I had with Fred Gibbs this semester, the technical work of this part of the dissertation is now done. I used Omeka with the Scripto plugin (which is really a bridge to a MediaWiki installation) for the archive, and an Exhibit from MIT’s Simile project for a quick and dirty display of data and a map plotting the location of several of the tunnel locations.

Also part of the course, is to give a brief presentation about the final project, which is taken from this post.

Goals

I had two goals for this course.

  1. Create an quick and easy way to display the location and information about some of the tunnel sites using a selection of documents.
  2. Create an online archive that would allow myself and others to transcribe and translate the documents.

Part 1

I was to use the Exhibit tool to complete the first goal. Set up was a bit more difficult than planned. I had an Exhibit working for a different project, and was finally able to massage the data into a copy of that code, and integrate it into the website using a WordPress Template.

Map showing the location of tunnel projects in the A and B groups.

This allowed me to display the data in three different views. First is the map, as seen above. I was able to show the tunnels in the two different groups identified in the documents. The A projects were existing tunnels, caves, or mines that were to be retrofitted and improved before factories could be moved in. B projects were to be completely new underground spaces.

The Exhibit also has a table view, showing all of the items with select information for easy comparison, or information retrieval at a glance. For each view, the right hand side provides options for filtering the data. Exhibit uses JavaScript, so with of the data is already present in the page,  filters and changes are applied instantly without any page reloads and slow data retrieval from the server.

A third view shows all of the items separately, with all of the available data.

Ideally, this information would be stored in a Google Spreadsheet to make updating and adding a cinch, but I was not able to get that working, so the data is in a JSON file instead. It would also have been neat to pull the information from the archive. Perhaps that can be built later.

Part 2

I also set up an Omeka install to host the images I had previously digitized from the United States Holocaust Memorial Museum. I not only want an archive, but also a way to have others transcribe and translate the documents, so I installed the Scripto plugin which is dependent on a MediaWiki install as well.

The ability to transcribe and translate is also an integral part of my dissertation. I want to argue, and show that historical work can not and should not be done alone. One way to do this is to get help from the undergraduates in the German Language program here at George Mason University. The German Language director at GMU is all on board to have some of her upper level students take on translation as part of their course work. This not only helps me, but helps them learn German by looking at interesting historical documents (and hopefully get them interested in history), but also helps future researches to be able to search and find documents easier.

Transcribing and translating made possible by Scripto and MediaWiki.

Historical Questions

This was the hardest part of the course. I’m really good at creating digital stuff because that is what I do all day. But I’m a little rusty on the historical interpretation and asking questions. What also makes this hard is not knowing completely what data I have yet.

Part of the problem with coming up with good, probing questions, is that I haven’t had a lot of time to look at the documents to see what is there. Also, there is not much written on this topic, so I’m kind of figuring out the story as I go. It’s a lot easier to read secondary works and ask new questions, or ask old questions in different ways. But there are no questions yet, except what happened.

The bigger questions, in light of this course, should be about how does this technology that we learned help understand the history, or help generate new questions. Will displaying the data in different ways help me make connections and inspire ideas that I would not otherwise have made or thought? Do the digital tools allow me to process more data than I could do non-digitally?

Another stumbling block (or is it a building block, it’s all about perspective, right), comes from my recent trip to Germany for research. While there I met with Dr. Ulrich Herbert at the University of Freiburg. He’s somewhat of a scholar in the area of slave labor, and has kept up to date on the writings regarding the underground dispersal projects. His wise suggestion for my dissertation was to focus on a single tunnel site, rather than trying to write about the organization responsible for all of the dispersal projects. Such an undertaking would take a life time, he said. So now I need to focus on just one tunnel, rather than all of them. Fortunately, Dr. Herbert put me in contact with the Director of the Mittelbau-Dora Concentration Camp Memorial, Dr. Jens-Christian Wagner. With his help, I may be able to find a specific tunnel to focus on, and make my trip in July 2013 that much more profitable.

Organizing the Image Files

Sorting It All Out

These names are just about useless.

I have a lot of images from the United States Holocaust Memorial Museum already. It’s about time I start looking through them to see what information I can get. The first issue I ran into, besides the shear number of them, is how to tell which images to look at first. Chronologically would be the best, but how to tell which document image is chrnologically first when they all have a generic file name. When I took the images at USHMM, they were automatically names liked so:

  • KIC000294.jgp
  • KIC000295.jpg
  • KIC000296.jpg
  • KIC000297.jpg

Not very descriptive, to say the least. I needed a way to see which documents came first in the time line of events, so I started thinking up a format for naming the images that would automatically sort the images, but also provide needed information. Since most of the files are images of correspondence between individuals, I decided to have the “To” and “From” be part of the file name. The date is also and obvious inclusion for the file name. Starting with the year, then month, then day makes it easy to sort the images chronologically. But what about documents written on the same day, and documents with mutiple pages? There’s a way to incorporate that too. So here is the naming scheme that I settled on for these document images.

Year.Month.Day-DocumentNumber-PageNumber+To_From-Description

Year  = The last two digits of the year
Month = The two digit month
Day   = The two digit day

Document Number = Each Nazi document seems to have a number, seemingly assigned when written/typed

Page Number  = The page number, if only one page, use 1.

To   = To whom the document is written. If not known, use 'To'.
From = Who wrote the document. If not known, use 'From'

Description = English (for English translation), Spreadsheet, Chart, Graph, etc

This allows me to see briefly what kind of document the file contains at a glance.

That's much better. I can tell which file I need at a glance


Thinking Ahead (programatically)

In an effort to show my skills as a digital historian… Ah, shucks, I’m not kidding anyone there. If you notice the naming format, you’ll see some odd use of word separators, or the fact that I use word separators at all instead of just spaces. That’s my programming mind coming to the fore there. I work with servers, all of them use Linux. Linux is OK with spaces in file names, but life is sooooooo much easier when there are none. So, here I’m thinking ahead to what I’m going to do with these images. Their new names are not just pretty to look at, but they will help me later on when I want to manipulate large numbers of them. With certain word separators in the name, it will be relatively easy to write a script that will search through all of the files and be able to parse out the dates, names, document numbers, page numbers, and descriptions. This info can be put into a CSV file for easy editing and adding information in a SpreadSheet program, which can then later be uploaded to Omeka. So just by taking care to name the files correctly will save me a lot of time later down the road.

A graph showing the total area of two underground projects, A and B. They were looking to have 8x as much tunnel space by 1945 as they had in June, 1944 when the document was made.

Digging in to the dissertation

Pun intended, of course.

I found a really cool piece of software that will, I believe, be very helpful in writing the dissertation. It’s a Mac application called Scrivener. I found it while reading up on an influential digital historian’s blog, William Turkel. I like it because it organizes the writing process in the way I already think about it. I can write, or rearrange bits of text as if they were note cards, and so much more… I’ll let a few screen shots speak for themselves:


As you can see, I’ve been working on my outlines for the first two chapters. I was worried about integration with Zotero, but found this tip to be helpful. It’s a bit of a process, but sure beats doing all citations by hand.

Funding Update

Also, for an update, I have now applied to two big fellowships, USHMM and the GHI, with one more to go at the National Archives. I should hear back about the USHMM this month.

After that, it’s the big two, the Fulbright and the DAAD.

Sources Update

I have most of the documents scanned from USHMM. There are still a bunch of microfilms I should get digitized from the National Archives (or the originals from the German Archives). Now I just need to start going through them and translating and organizing. I’ll have a post on that later.

Detail of A4 at Hadmersleben

Above is a teaser of one of the documents. This detail shows the location of the proposed tunnels in relation to the town of Hadmersleben, in Germany. The different areas of the tunnel are labeled.